This topic describes how to generate the Problem summary report so that you can find bugs in your programs. In this section:
Introduction
You can generate a Problem summary report that provides insight into the bugs present in your programs. The bug detection and reporting module is integrated into Insure++. You can view the Problem summary report from the GUI or command line. You must enable the report in the control panel before Insure++ can output the report.
Enabling the Problem Summary Report
- Open Insure++ and choose Window > Control Panel...
- Enable the Bugs option in the Summarize section and click Save.
Generating the Problem Summary Report
- Run the instrumented application to begin collecting runtime data (see Windows Usage).
- Close the application after running your scenario. The Problem summary report will appear in the session directory.
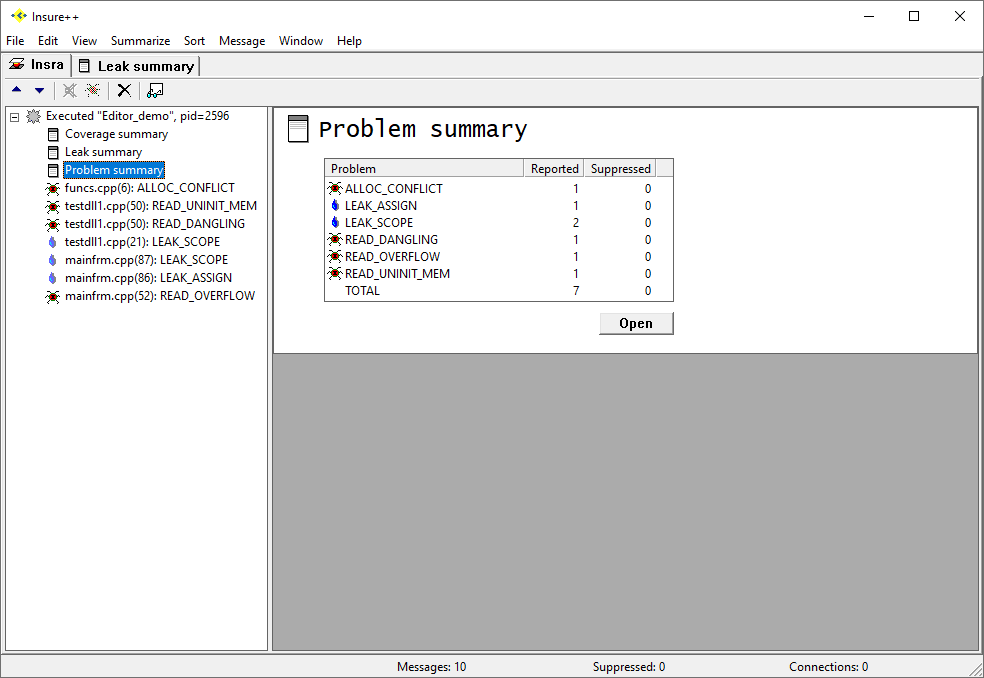
- Click on the report to view summary information.
Viewing the Problem Summary Report
You can perform the following actions after generating the report:
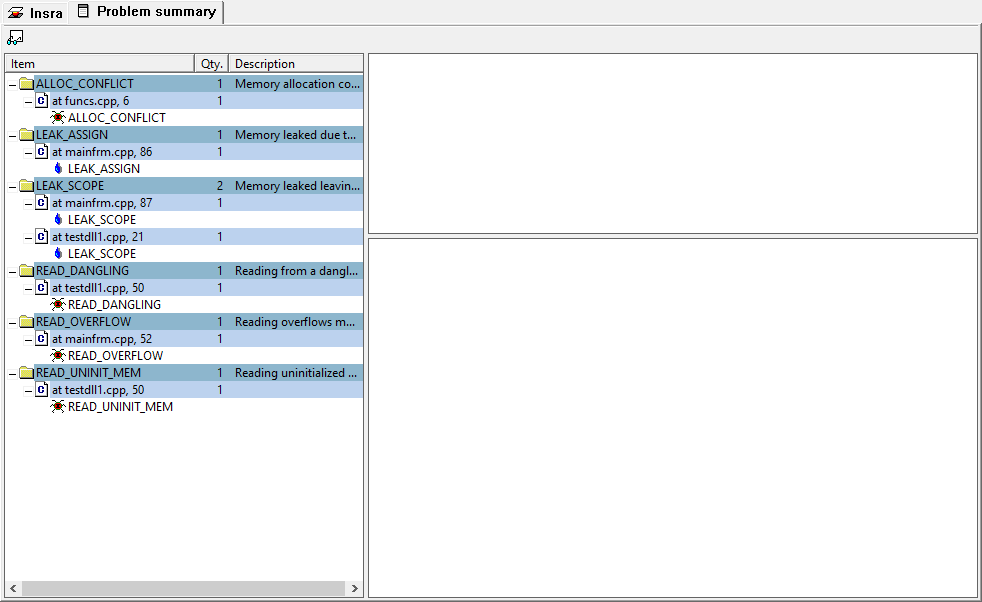
- Click Open in the summary overview page to view the report details. Bugs and memory leaks will be reported, but you can configure Insure++ to report only memory leaks (see Monitoring Memory Leaks).
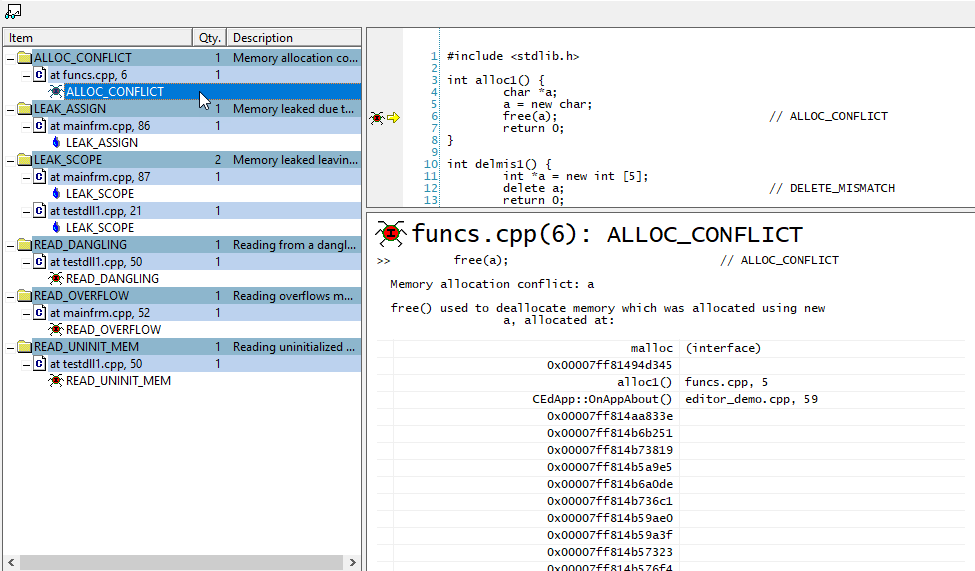
- You can expand items in the navigation pane and click on specific messages to view bug or memory leak details.
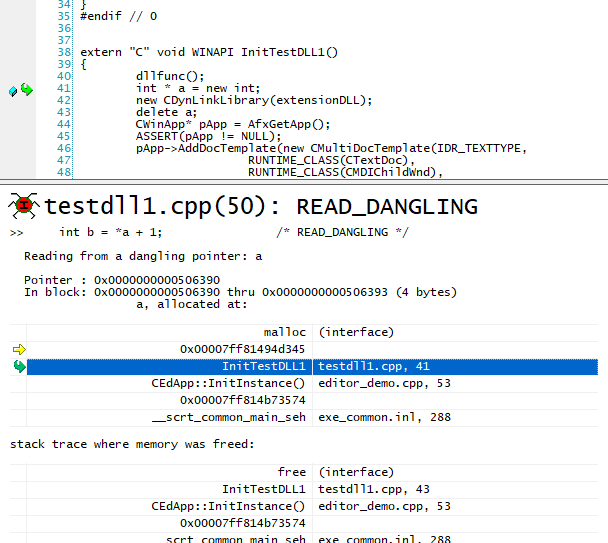
- Click on a bug or leak location in the details panel to view the point of error in the code.
- An icon and link appear at the line of code where the memory leak occurred. Click the link to open the code in your IDE.
Next Steps
See Viewing Results for additional information about understanding results.
See Working with Reports in Windows or Working with Reports on Unix for additional information about understanding and customizing Insure++ reports.


