Introduction
Connecting to DTP allows you to obtain the network license and extend team-working capabilities, such as:
- Reporting analysis to a centralized database (see Sending Results and Publishing Source Code to DTP)
- Sharing test configurations
- Sharing static analysis rules
In addition, DTP aggregates and prioritizes data collected from analysis tools, as well as performs additional analysis to help you optimize development processes; see About the Parasoft Development Testing Workflow for details.
Configuring Connection to DTP Server
The connection must be configured in the .properties configuration file (see Configuration Overview). Set the following properties to configure the connection:
dtp.server=[SERVER]dtp.port=[PORT]dtp.user=[USER]dtp.password=[PASSWORD]
We highly recommend that you use an encoded password to ensure successful authentication and increase the level of security; see Creating an Encoded Password.
Creating an Encoded Password
dotTEST can encrypt your password, which adds a layer of security to your interactions with DTP Server. Run the following command to print an encoded password:
-encodepass [MYPASSWORD]
Copy the encoded password that is returned and paste it into the dottestcli.properties file:
dtp.password=[ENCODED PASSWORD]
About the Parasoft Development Testing Workflow
In addition to providing licensing and shared assets for testing and analyzing your software under development, Parasoft DTP collects and merges data points from Parasoft tools, third-party analysis tools, and external systems, such as bug tracking and requirements tracking systems. It aggregates and prioritizes data, as well as performs additional analysis to help you optimize development processes. Using your code analysis and test execution tool with DTP enables you to consistently apply quality practices across teams and throughout the SDLC. The following illustration shows the general workflow. Parasoft tools ship with plugins for integration with your build tools (i.e., Maven, Ant, Gradle, MS Build, make, etc.). These integrations allow you to analyze code and send data to DTP automatically as part of the automated build processes and continuous integration (CI). When the analysis tool is running, it captures massive amounts of detailed data associated with the code referred to as “observations.” Observations are code quality data, such as static analysis violations, unit test failures, metrics, etc., as well as logistical information about the code, such as authorship, scope, and source control location. When observations are sent to DTP, they are converted into “findings” and stored in the database. Findings are observations that have been analyzed, normalized, and aggregated into actionable data. You can import priorities and filtered findings from DTP directly into your IDE so that issues can be addressed. When you check code back into source control, the continuous integration process picks up the change, and the workflow is repeated. This ensures that defects are detected and prevented from becoming software bugs later in the development process when the costs of remediation are much higher. 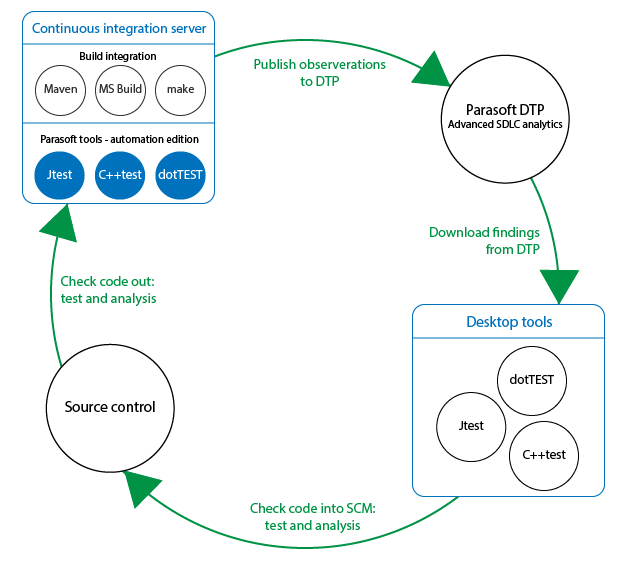
Integrating Parasoft Tools with the Build
Capturing Observations
Converting Data into Findings
Importing DTP Findings to the Desktop
Continuing the Cycle