...
Your compliance policy should be a measurable and achievable plan for releasing software that conforms to a security standard. You can also define a compliance goal that strives for a higher degree of guideline conformance. Your compliance goal (like your compliance policy) is encapsulated in a code analysis configuration. The difference is that you expect to comply your compliance policy prior to release, whereas you expect to run your compliance goal configuration with acceptable outcomes at some time in the future. This topic is discussed in greater detail in the Desktop and Automation for Later (Optional) sectionthe Implement Your Compliance Strategy section.
How Parasoft Supports Security Compliance Initiatives
Parasoft supports compliance initiatives with advanced code analysis and reporting technologies. Parasoft tools check the code for specific patterns that are known to result in software defects. The checkers (also called static analysis rules) map to guidelines within a standard. More than one checker may be required to verify that the code meets a guideline. Conversely, more than one guideline may rely on a single checker. Refer to the Glossary of Terms for for more detailed definitions of standards and guidelines.
|#_Glossary_of_Terms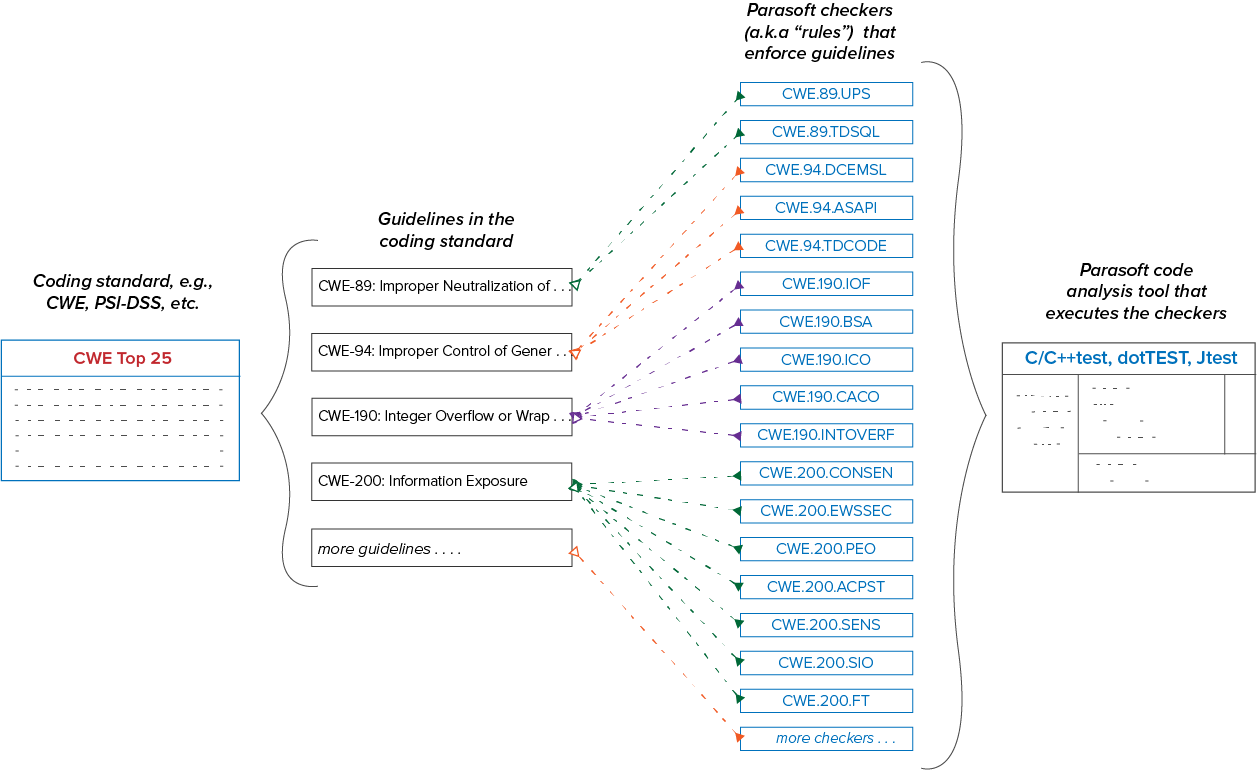
The mapping between Parasoft checkers and coding guidelines may have an impact on how you define compliance in your organization. A checker may report violations for guidelines that are critical to your application, as well as guidelines that are less relevant. This is why the ability to suppress violations (deviate from the standard) is important. Deviations are discussed in greater detail in the Documenting Deviations section.|#_Documenting_Deviations
Parasoft DTP collects the data and outputs guideline-specific visualizations and reports for monitoring and demonstrating compliance. This is discussed in greater detail in the Monitoring the Monitor and Demonstrating Compliance section.|#_Monitoring_and_DemonstratingAudit Compliance with Your Policy section.
Severities
Parasoft checkers are identified according to the standard that they check against. For example, a checker that applies the CWE guideline "CWE-22: Improper Limitation of a Pathname to a Restricted Directory" has the ID "CWE.22.TDFNAMES."
Checkers are also categorized by severity. Parasoft tools rank the violations they report from severity 1 ("sev1") to severity 5 ("sev5") with sev1 violations being the most important. The expectation is that sev1, sev2, and sev3 checkers report defects that require remediation, whereas sev5 checkers are used as inspections checkers (sev4 violations are not used in the Parasoft security compliance workflow). Inspection checkers flag code that should be manually reviewed to ensure that the code is compliant with a guideline. See Inspection Rules for for additional information.
Critical | Severity 1 |
High | Severity 2 |
Medium | Severity 3 |
Warning | Severity 4 |
Informational | Severity 5 |
...
Choose and Adapt a Test Configuration
...
The Parasoft Security Compliance Pack includes several test configurations that check compliance with the supported standards. When you install the Security Compliance Pack in DTP, the test configurations are automatically deployed to your DTP infrastructure. This enables you to centrally manage and distribute test configurations to your teams. Test configurations also ship with Parasoft tools for local execution, but using the test configurations stored in DTP enables you to uniformly apply checkers across teams (see Executing the Test Configuration).|#_Execute_and_Refine
Use the default test configurations as starting points and adapt them to meet your specific needs. Some checkers, for example, will need to be parameterized based on your code. Some checkers may not be a good fit for your codebase and should be disabled. If you do not need to handle input validation, for example, you may want to disable a checker that reports a violation when input validation isn't handled in a manner that's consistent with the guideline.
...
Refer to the following documentation for details on running within the IDE:
- C/C++test Standard
- C/C++test Professional (Eclipse)
- C/C++test Professional (Visual Studio)
- dotTEST dotTEST
- Jtest Jtest
Executing the test configuration on your complete project using the default settings may take a significant amount of time. One of the purposes of this step is to determine a baseline so that you can make decisions on how to balance resources to meet your compliance policy. You may determine that splitting checkers across several test configurations tuned for different milestones or development phases will be necessary.
By default, test configurations limit the code analysis results to 1000 violations per checker. If a rule is violating more than 1000 times, it means one of three things:
...
To understand the total scope of work, you should disable the limit during the baselining phase and re-enable it after modifying your test configuration. Disabling the 1000-violation limit may result in significantly longer execution time.
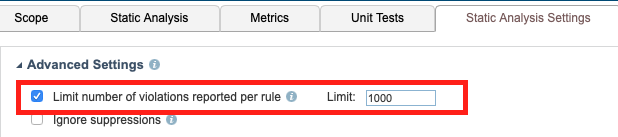
Refer to the DTP documentation for for details on how to change this setting.
...
Refer to the documentation for details on viewing reports in the desktop:
- C/C++test Standard
- C/C++test Professional (Eclipse)
- C/C++test Professional (Visual Studio)
- dotTEST
- Jtest
If you integrated Parasoft with your CI tool, then, in addition to the HTML output, you can review results in one of the supported systems. Refer to the Parasoft Findings Plugin documentation for documentation for details.
Viewing Results in DTP
See the Monitoring Monitor and Demonstrating Audit Compliance with Your Policy section for details about the available DTP interfaces for viewing static analysis violations.
...
- A large number of sev1 or sev2 violations likely require immediate attention.
- A large number of sev3 violations may point to a mismatch in your organizations coding culture and the type of violations reported by some checkers.
- A low number of violations (e.g., fewer than 200) may still represent a problem, especially if they are sev1 or sev2 violations.|#_Executing_the_Test
Updating Your Configuration
Browse the results and update your test configuration based on whether or not you are going to fix the reported violations. Refer to the DTP documentation for for details on how to update the test configuration.
Disable checkers that report violations that you are never going to fix. Suppress violations that are not acceptable in the reported instance but that you would otherwise fix (see see Applying Suppressions). Refer to your compliance policy (see Define Compliance Policy) for guidance on which checkers to disable and which violations to suppress.
...
You can mark violations for suppression from DTP. The suppression is implemented on the next code analysis run. Refer to the DTP documentation for for details on suppressing violations.
When static analysis violations are processed in DTP, desktop users can download violations, including suppressions, into their IDEs.
...
After a static analysis run, you can load the results into your IDE and suppress them using the GUI. In the phase described in the Monitoring Monitor and Demonstrating Audit Compliance with Your Policy section, you will download the results from DTP. Processed results are referred to in the IDE as "findings."
Refer to the tool documentation for details:
- C/C++test Standard
- C/C++test Professional (Eclipse)
- C/C++test Professional (Visual Studio)
- dotTEST
- Jtest
Determine Your Remediation Strategy
...
Refer to the DTP documentation for information on how to duplicate and and edit a a test configuration to use for local analysis.
Refer to the documentation for your tool for details on how to use configurations stored on DTP:
- C/C++test Standard
- dotTEST
- Jtest
- C/C++test Professional (Eclipse)
- C/C++test Professional (Visual Studio)
- dotTEST
- Jtest
Clean local code does not necessarily mean that the code will not trigger violations on the server. The automated build executes all checkers in the primary test configuration in the context of the scope of the entire code base. As a result, code that ran clean locally may result in violations when integrated with the rest of the build.
...
The Security Compliance Pack includes several dashboards optimized for viewing high-level information about the code analysis results in DTP. The dashboards include, for example, widgets that group violations according to risk and widgets that show changes in violations over time. Refer to the Security Compliance Pack documentation for for details about the widgets and reports included with the compliance pack. Additional details are covered in Monitoring in Monitor and Demonstrating Audit Compliance . |#_Monitoring_and_Demonstratingwith Your Policy.
Remediation Workflow
The Violations Explorer view in DTP is an interface for reviewing and prioritizing findings, as well as applying remediation workflows. You can flag violations for suppression in subsequent runs (see see Documenting Deviations), assign them to a team member, place them into external workflows, etc. Refer to the Violations Explorer view documentation documentation for usage.|#_Documenting_Deviations
Some widgets in the compliance-specific dashboards shipped with the Security Bundle link directly the Violations Explorer, but many widgets link to intermediate reports showing details associated with a specific aspect of the data. Refer to Monitoring to Monitor and Demonstrating Compliance for Audit Compliance with Your Policy section for details about the dashboards, widgets, and reports.
...
By default, priority is set to "Not defined," which can be changed in the Violations Explorer view. DTP also includes a REST API that enables you to programmatically control the metadata. You can also create an extension with the Extension Designer to automate prioritization when DTP collects the code analysis data. Refer to the API documentation (https://<YOUR_DTP_HOST>:<PORT>/grs/api) or the Extension Designer documentation for for details.
There are several rationales for setting metadata:
...
A consideration for this approach is that a high severity violation may normally be prioritized high but not in when it is reported in a part of the code with minimal security impact on the application. See See Severities for for details. |#_Severities
Based on Risk/Impact
The Risk/Impact field in DTP allows you to tag violations as extreme, high, moderate, and low. The default terminology used in this field is based on established risk score methods used in system engineering standards. You can also create custom tags that more accurately reflect conditions in your organization using the DTP REST API. Refer to the API documentation available at http://<host>:<port>/grs/api.
...
In many applications, certain parts of the codebase have a higher business value or represent greater risk than other parts. You can segment the code into resource groups and assign higher priorities to the findings associated with more valuable resources. Refer to the resource groups documentation for for details.
Creating Tickets in External Systems (Optional)
Parasoft ships with out-of-the-box integration points with external ticketing systems (e.g. Jira and VersionOne), enabling you to create issues in the systems based on violations reported to DTP. Refer to the documentation for configuration and usage information.
- Integrating with Jira
- Integrating with CodeBeamer ALM
- Integrating with Polarion ALM
- Integrating with VersionOne
You can also automate ticket creation either by using the REST API or by creating a custom workflow with Extension Designer. If you choose to fully automate ticket creation, make sure that you've fully tested your scripts, including error conditions, to avoid accidentally create thousands of tickets. If you choose to leverage this functionality, creating tickets manually is the recommended workflow.
...
A suppression applies to an instance of the violation, not to the checker, itself. The checker will continue reporting violations when the questionable pattern is detected in other parts of the code. If the checker truly does not apply to your application in any instance, disable it in the test configuration. Refer to the DTP documentation for for instructions.
Suppressions are also important in terms of the review process associated with inspection rules. Violations reported by inspection rules are designed to trigger a manual review of the code. When the code is verified per the standard, the inspection rule can be suppressed with a rationale that serves as the documentation for the deviation. See Inspection Rules for additional information.
...
Suppressing violations in DTP adds an instruction for the code analysis tool to apply the violation during the next code analysis run. The rationale for the suppression is part of your deviation documentation and must be concise. See the the DTP documentation for for instructions on suppressing violations in DTP.
...
Violations are also referred to as "findings" when they've been processed and tagged with analytics data. You can suppress individual instances of findings, all instances of a finding type in a file, or all findings in the file from the Findings view in C/C++test, dotTEST, and Jtest. Refer to the tool documentation for instructions:
- C/C++test Standard
- dotTEST
- Jtest
- C/C++test Professional (Eclipse)
- C/C++test Professional (Visual Studio)
- dotTEST
- Jtest
Deviation Approval and Audit Workflow
...
The Security Compliance Pack includes a Deviations Report that you can review in DTP. You should review the report as part of your code review process. You can export the report to PDF and check it into your SCM for auditing purposes. Refer to the documentation for the specific standard you intend to comply with for details:
DTP includes an Action field that you can leverage as part of the suppression audit process. This field includes the following default values:
...
You can set the action to Suppress and assign the violation to a reviewer who will agree and suppress the violation or make the case that the violation should not be suppressed in the comments. In this way, you create an audit trail in DTP around your suppressions. Refer to the Violation Explorer documentation for for details.
High Deviation Counts
Coding standards are not perfect, one-size-fits-all sets of rules—which is why deviations are permissible in the first place. A high number of deviations, however, suggests that additional action should be taken.
The checker may simply need to be turned off in the test configuration (see Choose and Adapt a Test Configuration). The severity of the reported violations may need to be lowered (see Updating Customizing Rule MapsProperties). The assignee or author may require additional training. The checker may be serving an "inspection rule" role (see Inspection Rules).
...
Checkers that report severity 5 (sev5) violations serve as inspection rules, which flag potential problems that require human oversight (also see Severitiessee Severitites). When sev5 violations are reported in DTP, the action field should be set to Review and assigned to a team member for processing. |#_Severities
Inspection rules are noisy by nature. This is because they are intended to serve as a method calling attention to areas of the code that require manual peer review. If your security compliance strategy is to first prioritize compliance coverage, then you should disable sev5 checkers and focus on sev1, sev2, and sev3 violations. Inspection rules will eventually need to be re-enabled, however, because you will not be able to claim full compliance with guidelines that require manual inspection.
...
After processing the violations, developers can download them from DTP and load them into their IDEs. This workflow enables developers to hit the ground running on outstanding issues by immediately providing feedback as soon as they start their IDEs. The IDE should be configured to import only critical and high priority findings. Refer to the documentation for your tool for instructions on importing findings into the IDE:
- C/C++test Standard
- C/C++test Professional (Eclipse)
- C/C++test Professional (Visual Studio)
- dotTEST
- Jtest
Developers should treat the remediation of findings assigned to them as a regular part of their day-to-day workflow. They should also strive to check in code that does not trigger new violations so that each iteration brings the project closer to full compliance with the policy.
...
Each standard supported by the Security Compliance Pack includes several components for monitoring and demonstrating compliance. Only violations reported by checkers in the compliance test configuration will appear in the compliance pack dashboards and reports. Refer to the documentation for each compliance artifact for details about adding compliance dashboards, viewing widgets, and viewing reports:
...
...
...
Dashboards
The dashboard templates shipped with the compliance pack include compliance specific widgets that show the compliance status for your project from several perspectives. The dashboards also leverage standard DTP widgets and reconfigure instances of the widgets to show data in context of the specific standard.
...