...
| Table of Contents | ||
|---|---|---|
|
| Expand | ||||
|---|---|---|---|---|
| ||||
|
Executive Summary
This guide is intended to help you achieve your security compliance objectives using Parasoft's deep code analysis and advanced development analytics technologies. Parasoft code analysis tools secure and harden your code, while Parasoft analytics monitor and track progress toward security compliance goals. Parasoft also provides reporting mechanisms for demonstrating compliance during an audit.
...
Parasoft Jtest must be integrated into one of the following supported build systems to automate analysis and run tests:
You can configure specific aspects of the analysis, such as which test configuration to execute, in the .properties file, in the build file, or both.
...
Parasoft dotTEST supports integration with MSBuild and NAnt, but a build system is not required to automate analysis. Although build system integration eases automation, you can use a script to launch dotTEST with a specific .properties file and command line switches to configure code analysis execution.
Building with C/C++test
A variety of build systems are available for C and C++ development, including Make, CMake, Bazel, Bitbake, custom scripts, etc. Parasoft provides flexible ways to integrate with both common and custom build systems.
- Running Static Analysis (C/C++test Standard)
- Creating a Project Using an Existing Build System (C/C++test Professional for Eclipse)
- Creating a Project Using an Existing Build System (C/C++test Professional for Visual Studio)
...
The Parasoft Security Bundle is a package of tools for your DTP infrastructure that provide visibility into your security compliance efforts. The Security Bundle contains configurations that align the findings sent to DTP with security guidelines. It also includes specialized reporting mechanisms that enable you to demonstrate compliance with guidelines for auditing purposes.
Refer to the Security Bundle documentation for installation instructions and other details.
...
Refer to the following documentation for details on running within the IDE:
- C/C++test Standard
- C/C++test Professional (Eclipse)
- C/C++test Professional (Visual Studio)
- dotTEST
- Jtest
Executing the test configuration on your complete project using the default settings may take a significant amount of time. One of the purposes of this step is to determine a baseline so that you can make decisions on how to balance resources to meet your compliance policy. You may determine that splitting checkers across several test configurations tuned for different milestones or development phases will be necessary.
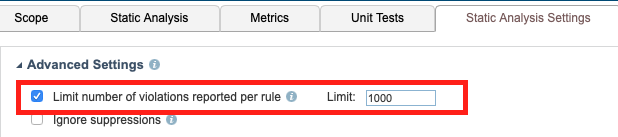
By default, test configurations limit the code analysis results to 1000 violations per checker. If a rule is violating more than 1000 times, it means one of three things:
...
To understand the total scope of work, you should disable the limit during the baselining phase and re-enable it after modifying your test configuration. Disabling the 1000-violation limit may result in significantly longer execution time.
Refer to the DTP documentation for details on how to change this setting.
...
Refer to the documentation for details on viewing reports in the desktop:
- C/C++test Standard
- C/C++test Professional (Eclipse)
- C/C++test Professional (Visual Studio)
- dotTEST
- Jtest
If you integrated Parasoft with your CI tool, then, in addition to the HTML output, you can review results in one of the supported systems. Refer to the Parasoft Findings documentation for details.
...
Browse the results and update your test configuration based on whether or not you are going to fix the reported violations. Refer to the DTP documentation for details on how to update the test configuration.
...
You can mark violations for suppression from DTP. The suppression is implemented on the next code analysis run. Refer to the DTP documentation for details on suppressing violations. When static analysis violations are processed in DTP, desktop users can download violations, including suppressions, into their IDEs.
...
After a static analysis run, you can load the results into your IDE and suppress them using the GUI. In the phase described in the Monitor and Audit Compliance with Your Policy section, you will download the results from DTP. Processed results are referred to in the IDE as "findings."
Refer to the tool documentation for details:
- C/C++test Standard
- C/C++test Professional (Eclipse)
- C/C++test Professional (Visual Studio)
- dotTEST
- Jtest
Determine Your Remediation Strategy
...
Refer to the documentation for your tool for details on how to use configurations stored on DTP:
- C/C++test Standard
- C/C++test Professional (Eclipse)
- C/C++test Professional (Visual Studio)
- dotTEST
- Jtest
Clean local code does not necessarily mean that the code will not trigger violations on the server. The automated build executes all checkers in the primary test configuration in the context of the scope of the entire code base. As a result, code that ran clean locally may result in violations when integrated with the rest of the build.
...
The Security Compliance Pack includes several dashboards optimized for viewing high-level information about the code analysis results in DTP. The dashboards include, for example, widgets that group violations according to risk and widgets that show changes in violations over time. Refer to the Security Compliance Pack documentation for details about the widgets and reports included with the compliance pack. Additional details are covered in Monitor and Audit Compliance with Your Policy.
...
The Violations Explorer view in DTP is an interface for reviewing and prioritizing findings, as well as applying remediation workflows. You can flag violations for suppression in subsequent runs (see Documenting Deviations), assign them to a team member, place them into external workflows, etc. Refer to the Violations Explorer documentation for usage.
...
By default, priority is set to "Not defined," which can be changed in the Violations Explorer view. DTP also includes a REST API that enables you to programmatically control the metadata. You can also create an extension with the Extension Designer to automate prioritization when DTP collects the code analysis data. Refer to the API documentation (https://<YOUR_DTP_HOST>:<PORT>/grs/api) or the Extension Designer documentation for details.
There are several rationales for setting metadata:
...
In many applications, certain parts of the codebase have a higher business value or represent greater risk than other parts. You can segment the code into resource groups and assign higher priorities to the findings associated with more valuable resources. Refer to the resource groups documentation for details.
Creating Tickets in External Systems (Optional)
Parasoft ships with out-of-the-box integration points with external ticketing systems (e.g. Jira and VersionOne), enabling you to create issues in the systems based on violations reported to DTP. Refer to the documentation for configuration and usage information.
- Integrating with Jira
- Integrating with CodeBeamer ALM
- Integrating with Polarion ALM
- Integrating with TeamForge
- Integrating with VersionOne
You can also automate ticket creation either by using the REST API or by creating a custom workflow with Extension Designer. If you choose to fully automate ticket creation, make sure that you've fully tested your scripts, including error conditions, to avoid accidentally create thousands of tickets. If you choose to leverage this functionality, creating tickets manually is the recommended workflow.
...
A suppression applies to an instance of the violation, not to the checker, itself. The checker will continue reporting violations when the questionable pattern is detected in other parts of the code. If the checker truly does not apply to your application in any instance, disable it in the test configuration. Refer to the DTP documentation for instructions.
Suppressions are also important in terms of the review process associated with inspection rules. Violations reported by inspection rules are designed to trigger a manual review of the code. When the code is verified per the standard, the inspection rule can be suppressed with a rationale that serves as the documentation for the deviation. See Inspection Rules for additional information.
...
Suppressing violations in DTP adds an instruction for the code analysis tool to apply the violation during the next code analysis run. The rationale for the suppression is part of your deviation documentation and must be concise. See the DTP documentation for instructions on suppressing violations in DTP.
...
Violations are also referred to as "findings" when they've been processed and tagged with analytics data. You can suppress individual instances of findings, all instances of a finding type in a file, or all findings in the file from the Findings view in C/C++test, dotTEST, and Jtest. Refer to the tool documentation for instructions:
- C/C++test Standard
- C/C++test Professional (Eclipse)
- C/C++test Professional (Visual Studio)
- dotTEST
- Jtest
Deviation Approval and Audit Workflow
...
The Security Compliance Pack includes a Deviations Report that you can review in DTP. You should review the report as part of your code review process. You can export the report to PDF and check it into your SCM for auditing purposes. Refer to the documentation for the specific standard you intend to comply with for details:
DTP includes an Action field that you can leverage as part of the suppression audit process. This field includes the following default values:
...
You can set the action to Suppress and assign the violation to a reviewer who will agree and suppress the violation or make the case that the violation should not be suppressed in the comments. In this way, you create an audit trail in DTP around your suppressions. Refer to the Violation Explorer documentation for details.
High Deviation Counts
Coding standards are not perfect, one-size-fits-all sets of rules—which is why deviations are permissible in the first place. A high number of deviations, however, suggests that additional action should be taken.
The checker may simply need to be turned off in the test configuration (see Choose and Adapt a Test Configuration). The severity of the reported violations may need to be lowered (see Customizing Rule Properties). The assignee or author may require additional training. The checker may be serving an "inspection rule" role (see Inspection Rules).
...
After processing the violations, developers can download them from DTP and load them into their IDEs. This workflow enables developers to hit the ground running on outstanding issues by immediately providing feedback as soon as they start their IDEs. The IDE should be configured to import only critical and high priority findings. Refer to the documentation for your tool for instructions on importing findings into the IDE:
- C/C++test Standard
- C/C++test Professional (Eclipse)
- C/C++test Professional (Visual Studio)
- dotTEST
- Jtest
Developers should treat the remediation of findings assigned to them as a regular part of their day-to-day workflow. They should also strive to check in code that does not trigger new violations so that each iteration brings the project closer to full compliance with the policy.
...
Each standard supported by the Security Compliance Pack includes several components for monitoring and demonstrating compliance. Only violations reported by checkers in the compliance test configuration will appear in the compliance pack dashboards and reports. Refer to the documentation for each compliance artifact for details about adding compliance dashboards, viewing widgets, and viewing reports:
Dashboards
The dashboard templates shipped with the compliance pack include compliance specific widgets that show the compliance status for your project from several perspectives. The dashboards also leverage standard DTP widgets and reconfigure instances of the widgets to show data in context of the specific standard.
...
Each Parasoft compliance artifact includes widgets specific to those standards. You can create a custom dashboard and add widgets configured to show data from each project using filters (see Creating and Managing Filters in the DTP documentation). Refer to the following DTP documentation for information about creating custom dashboards and manually configuring widgets:
- Adding a Dashboard
- Manually Adding the CERT C Widgets
- Manually Adding the CERT C++ Widgets
- Manually Adding the CWE Widgets
- Manually Adding the OWASP Widgets
Advanced Compliance Monitoring Tools
...
The compliance pack includes the Key Performance Indicator artifact that you can execute to calculate KPIs associated with the standard you've selected. KPIs are useful for comparing projects and for estimating risk and effort. This helps you understand the costs and effort associated with complying with your security guidelines. Refer to the following documentation for details on using the KPI functionality:
Resource Groups and Filters
...
A resource group is a collection of resources (i.e., files and/or folders) defined by a set of one or more Ant file patterns. Resource groups enable more granular views of the data associated with a filter. After associating a resource group with a filter, the data presented in all widgets, reports, and explorer views for static analysis violations and metrics results will be narrowed according to the defined pattern.
Refer to the DTP documentation for details.
Advanced Configuration and Strategies
...
You will need to add the <ruleId>.rule file to your tool's rules directory, enable the checker in the test configuration, and define it in the rule map. Refer to the DTP documentation for details.
Changing Severities
If the violation severity reported by a checker does not match your policy, you can modify the rule map in DTP to assign a new severity level, as well as change the checker ID or category. Refer to the DTP documentation for details.
Customizing the Compliance Pack
...
You can upload, export, and modify profiles using the DTP Enterprise Pack module. Refer to the Enterprise Pack documentation for general information about profiles.
...
As you work toward your long-term compliance goal, you may want to incrementally enable additional checkers in your test configuration. Duplicate your primary test configuration and add one or more checkers. Before executing analysis, however, add a filter to your project and configure your tool to send the what-if execution results to the new filter. In this way, you are can keep exploratory analysis results separate from your official compliance data. Refer to the DTP documentation to learn more about filters.
...
Contact your Parasoft representative for Parasoft Multi-Language Pack download and license information.
DTP and Enterprise Pack 2020.1
Standards |
|
|---|---|
Parasoft tools |
|
Continuous integration | Parasoft can report static analysis violations in the following CI systems:
You can integrate with other CI systems using the command line interface. |
Source control | Refer to the tool documentation for supported SCMs: |
DTP and Enterprise Pack 5.4.3
...