...
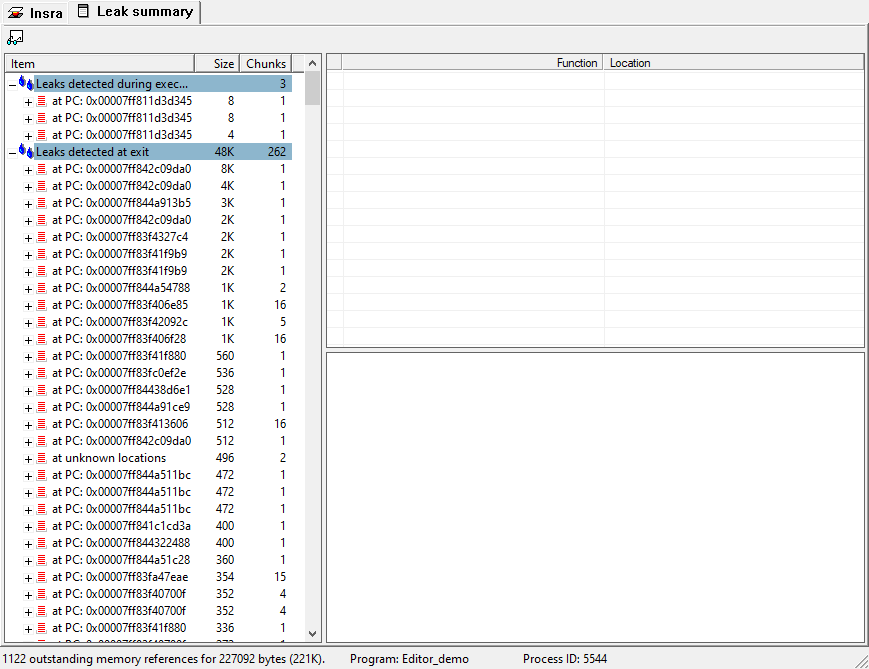
You can generate a Leak summary that provides insight into how your programs handle memory. The memory monitoring and reporting module is integrated into Insure++ on Windows distributions of Insure++. You can view the Leak summary report from the GUI or command line on Windows. You must enable the report in the control panel before Insure++ can output the report.
...
- Click Open in the summary overview page to view the report details.
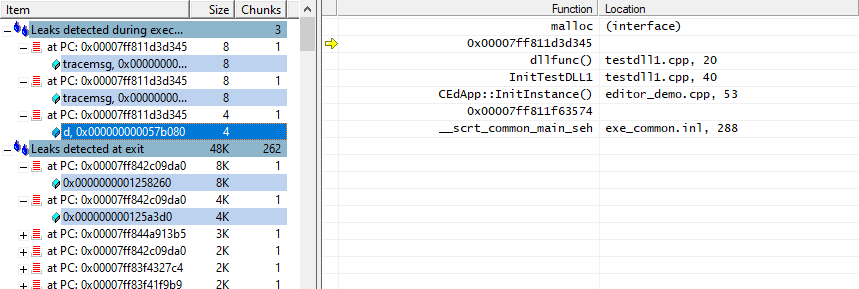
- You can expand items in the navigation pane and click on specific messages to view memory leak details.
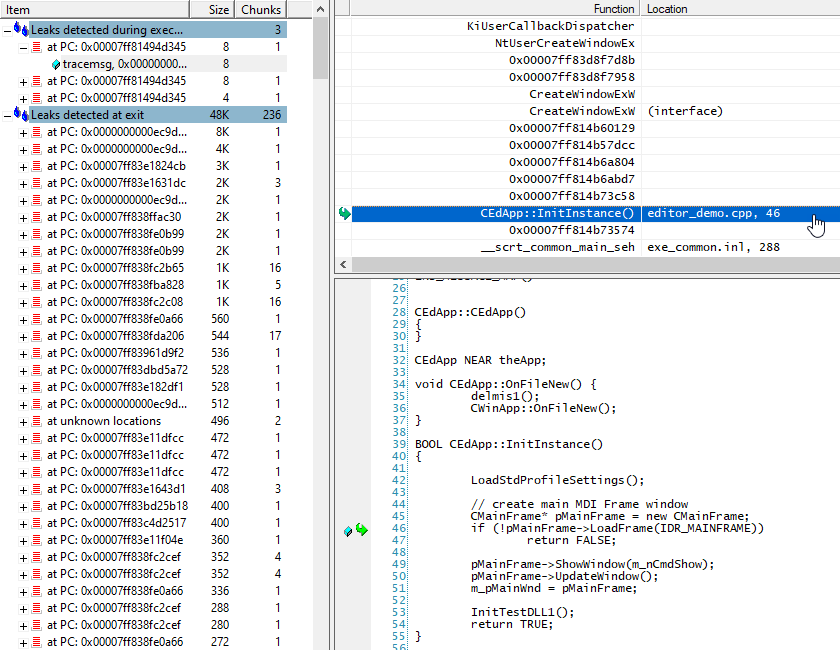
- Click on a leak location in the details panel to view the point of error in the code.
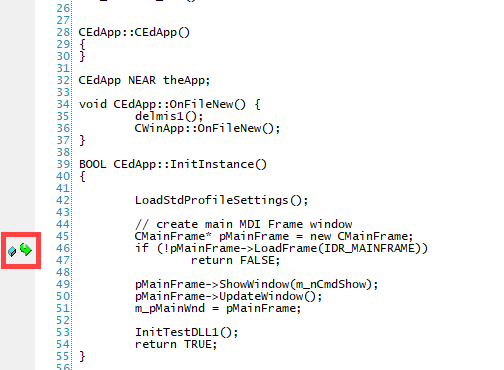
- An icon and link appear at the line of code where the memory leak occurred. Click the link to open the code in your IDE.
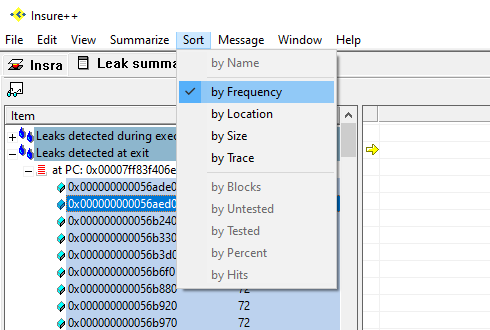
- You can sort messages by choosing an option from the Insure++ Sort menu.
Next Steps
See Viewing Results on Windows for additional information about understanding results.
See Working with Reports in Windows or Working with Insure++ Reports on Unix for additional information about understanding and customizing Insure++ reports.
