This topic explains how you create and use monitors to collect network information and system performance data during load testing. Monitoring metrics can be overlaid onto load test results to help you determine whether the load passed to the Web server is being handled as designed.
Supported monitors include:
- SNMP
- Windows monitors (available only on Windows installations of Load Test)
- WebSphere
- WebLogic
- JBoss
- Tomcat
- rstat
- remote
- deployed (e.g., AppDynamics, Dynatrace)
- custom
Performance Monitor for Oracle Service Bus (OSB/ALSB)
A performance monitor for Oracle Service Bus (OSB/ALSB) is available. Contact technical support for details.
Adding Built-In Monitors
Adding SNMP Agent Monitors
Load Test can retrieve data based on the provided OID(s) from the SNMP agents of versions 1 and 2c.
To add an SNMP agent monitor:
- Right-click the Load Test tab’s Monitors node, then choose New Monitors from the shortcut menu. A New Monitors dialog displays.
- Select SNMP from the New Monitors dialog, then click Finish. A configuration panel for the new monitor will open in the right panel.
- Type the SNMP agent’s host name in the Host field.
- Type the SNMP agent’s community in the Community field.
- Enter a parameter by clicking New. The New Parameter dialog opens.
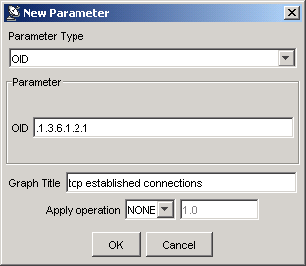
- Complete the New Parameter dialog as follows:
- Parameter Type: Select OID or Composite.
- Parameter: Depending on the Parameter Type selected, the Parameter options will vary according to the following:
- OID: Enter the Object ID that identifies a specific parameter within the SNMP agent community. (Only available if OID is selected in the Parameter Type drop-down menu).
- Composite: Select Processor, Memory, Network, or TCP to collect corresponding data.
- Counters: Depending on the selection from the Composite parameter drop-down menu, displays CPU Utilization (%), Memory Utilization (%), and Network Utilization (%); these counters are calculated by querying a set of OIDs.
If TCP is selected from the Composite parameter drop-down menu, you must select a counter from the Counters box. - Parameter Explanation: Displays an explanation for the Composite parameter selected.
- Graph Title: Enter a title for the graph that will correspond to the Monitor you are adding. This title will display in Load Test Progress graphs, and in Detailed Report graphs.
- Apply operation: Select to apply simple operations to values returned by an SNMP agent. Use "*" for "multiply", "/" for "divide", and "%" for "percentage of". For example, if the agent returns the value of the allocated memory in bytes but you want to see it in KB, you would apply a "/ 1024" operation by selecting "/" from the drop-down menu and entering "1024" in the adjacent text field. You could then add "Memory in kilobytes" into the Graph Title field.
- Repeat the above step until the Parameters table shows all parameters you want this SNMP agent to monitor.
- Verify the new monitor by right-clicking the related node in the Load Tests tree’s Monitors> SNMP branch.
Adding Windows Performance Monitors
To add a Windows performance monitor (functionality which is only available if you have a Windows installation of Load Test):
- Right-click the Load Test tab’s Monitors node, then choose New Monitors from the shortcut menu. A New Monitors dialog displays.
- Select Windows from the New Monitors dialog, then click Finish.
- Type the perfmon’s host name in the Host field.
- Enter a parameter by clicking New. The Add performance counter dialog opens.
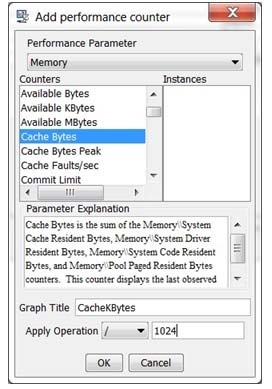
- Complete the New Parameter dialog as follows:
- Select the performance counter and instance of the parameter you want to monitor. An explanation of the parameter you select displays in the Parameter Explanation box.
- In the Graph Title field, enter a title for the graph that will correspond to the Monitor you are adding. This title will display in Load Test Progress graphs, and in Detailed Report graphs.
- In the Apply Operation sub-panel, select an operation and a value to be applied to the monitor data if needed. For example, by selecting the / (divide) operation and entering
1024in the operation value field, you could convert the original monitor value from Bytes to KBytes.
- Repeat the above step until the Parameters table shows all parameters you want this perfmon to monitor.
- Verify the new monitor by right-clicking the related node in the Load Tests tree’s Monitors> Windows branch.
Adding WebSphere Monitors
Before adding a WebSphere monitor, go to the Security> Global security section of the WebSphere Administrative console and ensure that the Enable administrative security check box is unselected.
To add a WebSphere monitor:
- Right-click the Load Test tab’s Monitors node, then choose New Monitors from the shortcut menu. A New Monitors dialog displays.
- Select WebSphere from the New Monitors dialog, then click Finish.
- In the Project Configuration panel, click Configure. A Configure WebSphere Agent dialog displays.
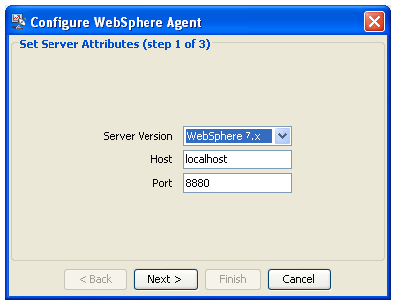
- Enter the Host name, change the Port number if necessary, then click Next.
- In the Configure WebSphere Agent panel, enter or browse to the appropriate Path of the WebSphere installation. For example: C:\IBM\WebSphere.
- Click Next. The Configure WebSphere Agent dialog displays a table of the required Jar files for the server and indicates whether or not the appropriate Jar files were found.
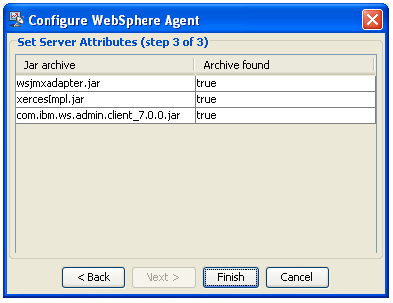
- In the Configure WebSphere Agent dialog, click Finish. The Add Parameter dialog opens.
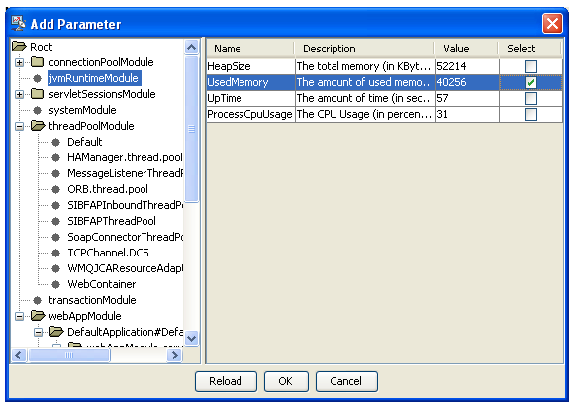
- Select a Parameter from the left GUI panel of the Add Parameter dialog. The Name, Description, and Value for each instance of the parameter you want to monitor displays in the right GUI panel of the Add Parameter dialog.
- In Select column from the right GUI panel, check the parameter instances that you want to monitor, then click OK. The parameters you choose will display in Load Test Progress graphs, and in Detailed Report graphs.
Adding WebLogic Monitors
To add a WebLogic Monitor:
- Right-click the Load Test tab’s Monitors node, then choose New Monitors from the shortcut menu. A New Monitors dialog displays.
- Select WebLogic from the New Monitors dialog, then click Finish.
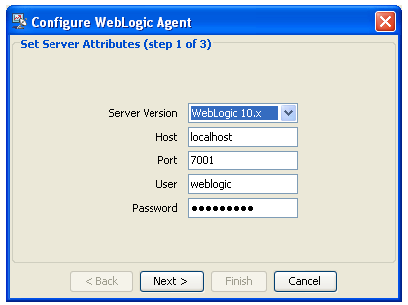
In the Project Configuration panel, click Configure. A Configure WebLogic Agent dialog displays.
Note
For WebLogic 8.1 SP6 and WebLogic 9.x monitors, Load Test needs to be started with the
-Dsun.lang.ClassLoader.allowArraySyntax=trueoption. To do that in the command prompt, navigate to the Load Test installation directory and run the following command:lt -Dsun.lang.ClassLoader.allowArraySyntax=true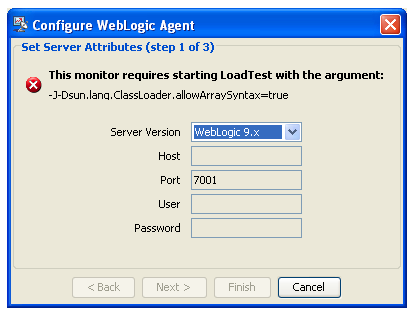
- Enter the Host name, change the Port number if necessary, then click the Next.
- In the Configure WebLogic Agent panel, enter or browse to the appropriate Path of the desired WebLogic implementation on your machine. For example: C:\Oracle\Middleware\wlserver_10.3.
- Click Next. The Configure WebLogic Agent dialog displays a table of the required Jar files for the server and indicates whether or not the appropriate Jar files were found.
- In the Configure WebLogic Agent dialog, click Finish. The Add Parameter dialog opens.
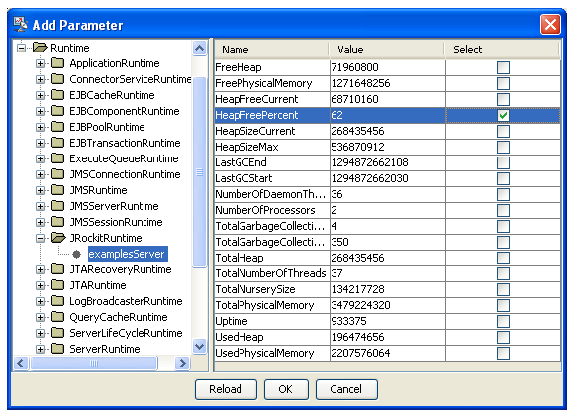
- Select a Parameter from the left GUI panel of the Add Parameter dialog. The Name, Description, and Value for each instance of the parameter you want to monitor displays in the right GUI panel of the Add Parameter dialog.
- In Select column from the right GUI panel, check the parameter instances that you want to monitor, then click OK. The parameters you choose will display in Load Test Progress graphs, and in Detailed Report graphs.
Adding JBoss Monitors
To add a JBoss monitor:
- Right-click the Load Test tab’s Monitors node, then choose New Monitors from the shortcut menu. A New Monitors dialog displays.
- Select JBoss from the New Monitors dialog, then click Finish.
- In the Project Configuration panel, click Configure. A Configure JBoss Agent dialog displays.
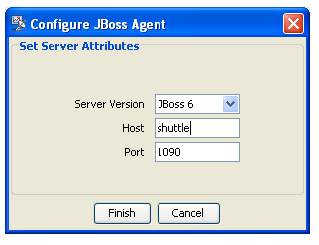
- In the Configure JBoss Agent dialog, enter host name, change port number if necessary, then click Finish. The Add Parameter dialog opens.
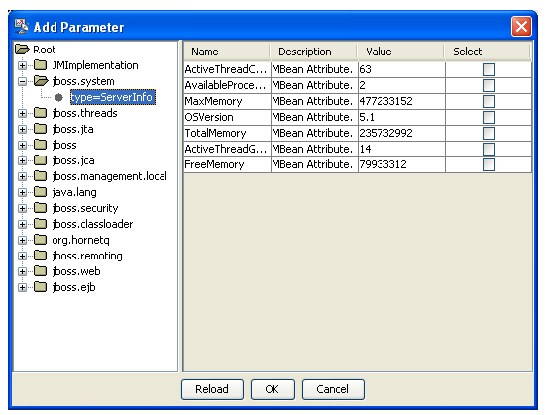
- Select a Parameter from the left GUI panel of the Add Parameter dialog. The Name, Description, and Value for each instance of the parameter you want to monitor displays in the right GUI panel of the Add Parameter dialog.
- In Select column from the right GUI panel, check the parameter instances that you want to monitor, then click OK. The parameters you choose will display in Load Test Progress graphs, and in Detailed Report graphs.
Adding Tomcat Monitors
Prerequisites
In order to use this monitor, Tomcat should be started with the following Java system properties:
- -Dcom.sun.management.jmxremote
- -Dcom.sun.management.jmxremote.port=7744
- -Dcom.sun.management.jmxremote.ssl=false
- -Dcom.sun.management.jmxremote.authenticate=false
Use the port of your choice with the com.sun.management.jmxremote.port system property.
For example, on Windows you can create a tomcat.bat file in the Tomcat installation "bin” directory and run this batch file to start Tomcat, or you can run this command from the command prompt:
java -Dcom.sun.management.jmxremote -Dcom.sun.management.jmxremote.port=7744 -Dcom.sun.management.jmxremote.ssl=false -Dcom.sun.management.jmxremote.authenticate=false -jar bootstrap.jar
To add a Tomcat monitor:
- Right-click the Load Test tab’s Monitors node, then choose New Monitors from the shortcut menu. A New Monitors dialog displays.
- Select Tomcat from the New Monitors dialog, then click Finish.
- In the Project Configuration panel, click Configure. A Configure Tomcat Agent dialog displays.
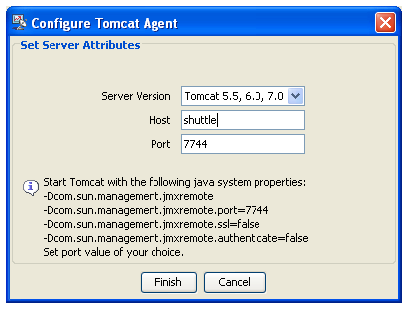
- In the Configure Tomcat Agent dialog, enter the host name, change the port number if necessary, then click Finish The Add Parameter dialog opens.
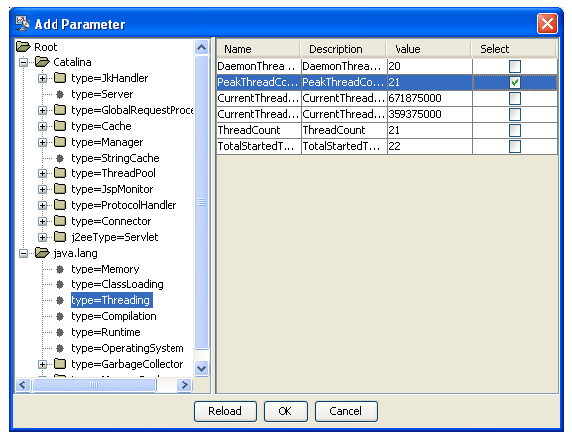
- Select a Parameter from the left GUI panel of the Add Parameter dialog. The Name, Description, and Value for each instance of the parameter you want to monitor displays in the right GUI panel of the Add Parameter dialog.
- In Select column from the right GUI panel, check the parameter instances that you want to monitor, then click OK. The parameters you choose will display in Load Test Progress graphs, and in Detailed Report graphs.
Adding rstat Monitors
To add an rstat monitor:
- Right-click the Load Test tab’s Monitors node, then choose New Monitors from the shortcut menu. A New Monitors dialog displays.
- Select rstat from the New Monitors dialog, then click Finish.
Note
For rstat monitors to be enabled, djrpc.jar and rstatcl.jar need to be in <SOAtest installation>\eclipse\plugins\com.parasoft.xtest.libs.web_<version>/root and added to the classpath.
The rstatcl.jar is added to <SOAtest_Installation>\<SOAtest_Version>\eclipse\plugins\com.parasoft.xtest.libs.web_<version>\root upon installation.
The djrpc.jar must be purchased and copied to <SOAtest installation>\eclipse\plugins\com.parasoft.xtest.libs.web_<version>/root.
Adding Remote JVM Monitors
Note
To use this monitor, the JVM should be started with the following Java system properties:
-Dcom.sun.management.jmxremote -Dcom.sun.management.jmxremote.port=7744 -Dcom.sun.management.jmxremote.ssl=false -Dcom.sun.management.jmxremote.authenticate=false
Use the port of your choice with the com.sun.management.jmxremote.port system property.
To add a remote JVM Monitor:
- Right-click the Load Test tab’s Monitors node, then choose New Monitors from the shortcut menu. A New Monitors dialog displays.
- Select Remote JVM from the New Monitors dialog, then click Finish.
- In the Project Configuration panel, click Configure. A Configure Remote JVM Agent dialog displays.
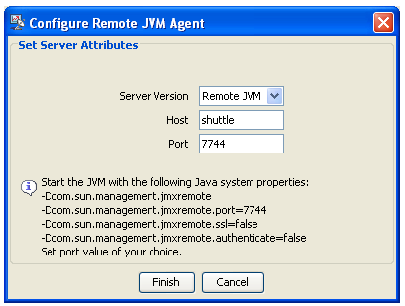
- In the Configure Remote JVM Agent dialog, enter host name and change port number if necessary and press the Finish button. The Add Parameter dialog opens.
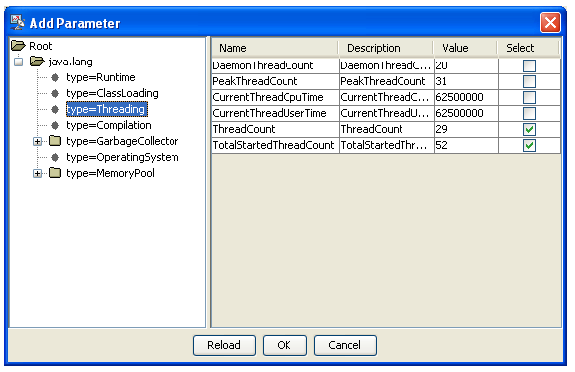
- Select a Parameter from the left GUI panel of the Add Parameter dialog. The Name, Description, and Value for each instance of the parameter you want to monitor displays in the right GUI panel of the Add Parameter dialog.
- In Select column from the right GUI panel, check the parameter instances that you want to monitor, then click OK. The parameters you choose will display in Load Test Progress graphs, and in Detailed Report graphs.
Adding Custom Monitors
Custom monitors can be implemented by JavaScript or Jython scripts, or by Java class methods. This is especially useful if you would like to collect data from sources that are not listed above.
Note
A channel method must return a java.lang.Number type in order to be plotted in Load Test Progress and Detailed Report graphs.
To add a custom monitor:
- Right-click the Load Test tab’s Monitors node, then choose New Monitors from the shortcut menu. A New Monitors dialog displays.
- Select Custom from the New Monitors dialog, then click Finish.
- Enter a name for the Custom monitor in the Name field.
- Click the New button. An Add Channel dialog opens.
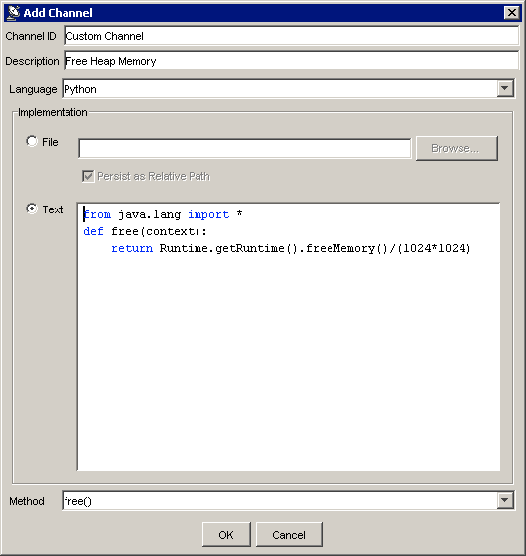
- Enter a name for the channel in the Channel ID field. The name you entered for the Custom Monitor, together with the Channel ID, will comprise the title of the monitor. This title will display in Load Test Progress graphs, and in Detailed Report graphs.
- (Optional) Enter a short description of the channel in the Description field.
- Select a language from the Language menu.
- Specify the script by doing one of the following:
- Select the File radio button and click the Browse button to select the appropriate file.
- Select the Text radio button and enter the script in the text field.
- Specify the method you want invoked from the Method menu.
- Click OK. The new custom channel is added to the Channels table in the right GUI panel.
Modifying Built-In Monitors
After a monitor has been created, you can set or modify the Apply Operation parameter for the following built-in monitor types:
- Windows
- JBoss
- Tomcat
- Remote JVM
- SNMP
To modify the operation, double-click the monitor channel in the Parameters panel of the monitor configuration view and set the appropriate operation type and value.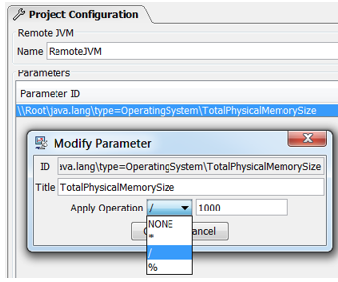
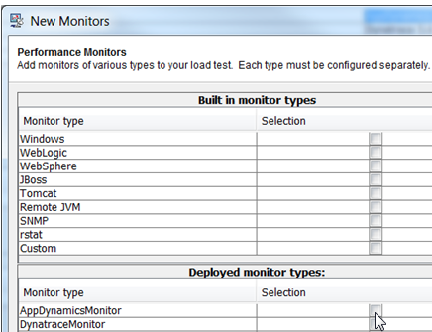
Adding Deployed Monitors
Load Test allows dynamically adding monitor types to the Load Test installation. Deployed monitors are displayed in the Deployed monitor types table of the Performance Monitors wizard.
AppDynamics
Adding AppDynamics Monitors
To add an AppDynamics monitor:
- Right-click the Load Test tab’s Monitors node, then choose New Monitors from the shortcut menu. A New Monitors dialog displays.
- Select AppDynamicsMonitor from the New Monitors dialog’s Deployed monitor types table, then click Finish.
- In the upper right corner of the Project Configuration panel, click the Properties button and configure the AppDynamics properties.
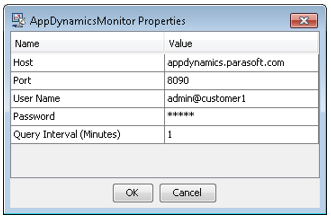
- Host – host where the AppDynamics server is installed.
- Port – port where AppDynamics is listening for REST calls.
- User Name – user name for REST calls authentication.
- Password – password for REST calls authentication.
- Query Interval (Minutes) – time in minutes over which the monitor values are averaged. The minimum value is 1 minute.
- Click OK to save the property values in the project.
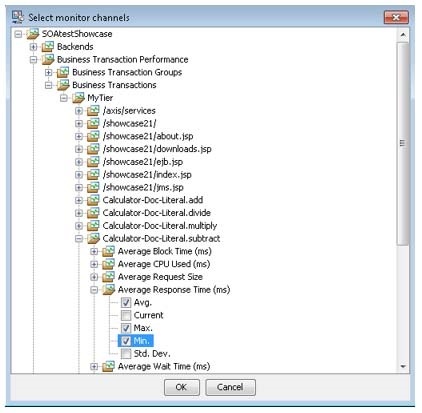
- To add channels to the AppDynamics monitor:
- Click the New button in the Deployed monitor panel of the Project Configuration tab. The monitor channel selection dialog displays. The top level nodes in monitor channel tree are applications monitored by AppDynamics.
- Expand the top level application nodes until you reach the channel leaf nodes with check boxes.
- Ensure that the items you want to monitor are checked.
- Click OK to have selected nodes added to the Parameters table of the Deployed monitor configuration panel. The parameters you choose will display in Load Test Progress graphs as well as in Detailed Report graphs.
Tip
Open the Properties dialog and click the OK button to reset the monitor channel selection tree. The monitor channels tree will display the top level application nodes based on the data provided by AppDynamics. The child nodes will be dynamically constructed based on queries sent to AppDynamics as you click the tree’s expand icons “[+]”.
Monitoring Data Available from AppDynamics Monitoring Extensions
The AppDynamics Exchange site offers a number of Monitoring Extensions. Monitoring Extension data available in AppDynamics Metric Browser will be available in the Load Test AppDynamics monitor.
The screenshots below show the data exposed by the ‘Static’ Monitoring Extension available from the Exchange in the AppDynamics Metric Browser View and the Load Test AppDynamics monitor channel selection view.
Custom FileContentMetric in AppDynamics: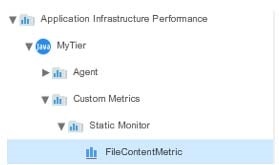
Custom FileContentMetric in Load Test AppDynamics Monitor: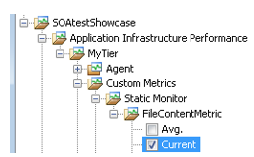
Dynatrace
Adding Dynatrace Monitors
To add a Dynatrace monitor:
- Right-click the Load Test tab’s Monitors node, then choose New Monitors from the shortcut menu. A New Monitors dialog displays.
- Select DynatraceMonitor from the New Monitors dialog’s Deployed monitor types table, then click Finish.
- In the upper right corner of the Project Configuration panel, click the Properties button and configure the Dynatrace properties.
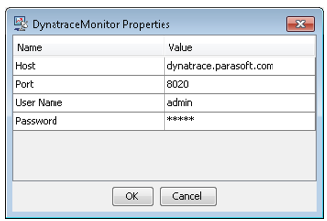
- Host – host where the Dynatrace server is installed.
- Port - port where Dynatrace is listening for REST calls. Default port is 8020. Refer to the Dynatrace documentation for more details.
- User Name - user name for REST calls authentication.
- Password - password for REST calls authentication.
- Click OK to save the property values in the project.
- To add channels to the Dynatrace monitor:
- Click the New button in the Deployed monitor panel of the Project Configuration tab. The monitor channel selection dialog displays.
- Expand the top level application nodes until you reach the channel leaf nodes with check boxes.
- Ensure that the items you want to monitor are checked.
- Click OK to have selected nodes added to the Parameters table of the Deployed monitor configuration panel. The parameters you choose will display in Load Test Progress graphs as well as in Detailed Report graphs.
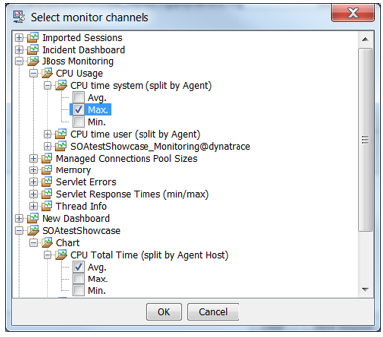
The monitor channel selection view tree is structured in the following way:
- Level 1: Dynatrace dashboards
- Level 2: Chart Dashlets in a dashboard
- Level 3: Measures in a Chart Dashlet
- Level 4: Min/Max/Avg vales of the Measure
- Level 3: Measures in a Chart Dashlet
- Level 2: Chart Dashlets in a dashboard
You can monitor either existing Chart Dashlets of Line Chart type or create new ones. You can add multiple Measures (data series) to a Chart Dashlet. See the Dynatrace vendor documentation for more details.
Tip
Open the Properties dialog and click the OK button to reset the monitor channel selection tree. The monitor channels tree will display the top level application nodes based on the data provided by Dynatrace. The child nodes will be dynamically constructed based on queries sent to Dynatrace as you click the tree’s expand icons “[+]”.
Dynatrace REST Query Response Size Considerations
The sizes of the Dynatrace REST responses can be quite large (100KB and more), depending on the Chart and Dashboard configurations.
To minimize the size of the Dynatrace REST query responses:
- In the charts of the dashboards that are being monitored by Load Test, choose the following settings in the Chart control panel in the top right corner of the Chart view.
- Select Timeframe: set to ‘last 5 minutes’.
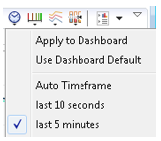
- Select Chart Resolution: set to ‘10s’
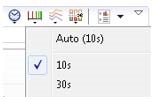
- Select Timeframe: set to ‘last 5 minutes’.
- To apply these settings to all charts in a dashboard, choose the Apply to Dashboard command in the right-click menu shown in screenshots above.
- To estimate the sizes of responses of REST queries of dashboards that are used by the Load Test Dynatrace monitor, open the query results in a browser using the following URL template (after substituting the host, port and the dashboard names to the ones relevant to your environment): http://dynatrace.parasoft.com:8020/rest/management/dashboard/your_dashboard_name
Monitoring Data Available from Dynatrace Plugins
The Dynatrace ‘PLUGIN CENTRAL’ site and ‘Community Plugins and Extensions’ site contain a number of plugins, many of which can be used to extend the out-of-the box Dynatrace monitoring capabilities. The Dynatrace plugin data added as a Measure to a Chart Dashlet will be available in the Load Test Dynatrace monitor.
The screenshots below show a StockQuote sample monitor plugin available from the ‘Community Plugins and Extensions’ site added as Measure in a Dynatrace Chart Dashlet and in Load Test Dynatrace monitor channel selection view.
Custom StockQuote Measure in Dynatrace: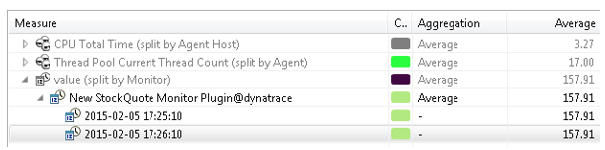
Custom StockQuote Channel in Load Test Dynatrace monitor: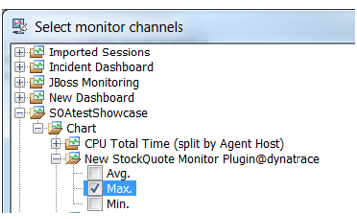
Querying Monitors
Once some parameters have been added to a monitor, they can be queried.
To send a query:
- Select the Load Tests tree node that represents the monitor you want to query.
- Click the Send Request button in the Response View area of the monitor’s configuration panel.
Query results will be displayed in the Response View area of the monitor’s configuration panel.
Verifying Monitor Status
The Load Tests tree uses color bubbles to indicate the status of each monitor. The following colors are used:
- White: Unchecked.
- Green: All parameters are available.
- Yellow: Some parameters are either unavailable, or their values are not numeric.
- Red: Monitor is unavailable or unreachable.
To verify the current state of one or more monitors:
- Right-click the Load Tests tree node that represents the monitor(s) you want to verify (either the Monitors node, the Windows node, the SNMP node, the Custom node, or the node that represents an individual monitor).
- Choose Verify from the shortcut menu.
Monitoring Behavior During Test Suite Load Testing
The monitors that you have added to the Load Tests tree will be used during test suite load testing.
During a load test that uses monitors, Load Test adds a bar for each monitor within the Graph tab of the Load Test Progress panel. The Graph tab displays data collected from the monitors. The names of these bars are based on the monitors’ Graph Title values, not by OID numbers or parameter IDs.
Accessing Monitor Results
Monitor data collected during load testing is saved in the Detailed Report, where it can be viewed together with and correlated to the default data (such as "Number of Virtual Users", etc.)