The following examples provide a brief tutorial on how to use Insure++ for runtime error detection. These examples focus on a project that is a text editor, similar to Notepad, that consists of a DLL and an executable and uses MFC. In this section:
Example 1 - Instrumenting Selected Project Files
Most projects are fairly large and contain multiple files. However, there are times when you will need to check only a handful of those files for suspected runtime violations. This is done when Insure++ instruments the individual files that you are checking. Individual files are linked to a non-instrumented executable. This finds errors in the files in question at the source level with a minimum of effort. To demonstrate this, follow these steps:
- Open Visual C++ and choose File> Open Workspace.
- Browse to the Insure++ examples directory (by default, <Insure++ Install Dir>/examples) and open the editor_demo directory.
- Open the solution file for your version of Visual Studio (for Visual C++, open the editor_demo.dsw workspace). If you are prompted to confirm, click Yes.
- Build editor_demo.exe without instrumentation by choosing Build> Rebuild All.
- Instrument the particular file that you wish to examine with Insure++ and rebuild by choosing funcs.cpp (in the Editor Demo files/Source files) from the File View tab and clicking the Instrument File icon.
- Click the Insure++ Build icon to link the executable when the instrumentation is process is complete.
- Run the program by clicking the Insure++ Execute icon.
- In the text editor example GUI, exercise the example application by completing the following steps:
- Click the New File icon
- Click the About (?) icon
- Exit the application.
- Review the output in Insra. You will see two errors for the instrumented file: DELETE_MISMATCH and ALLOC_CONFLICT.
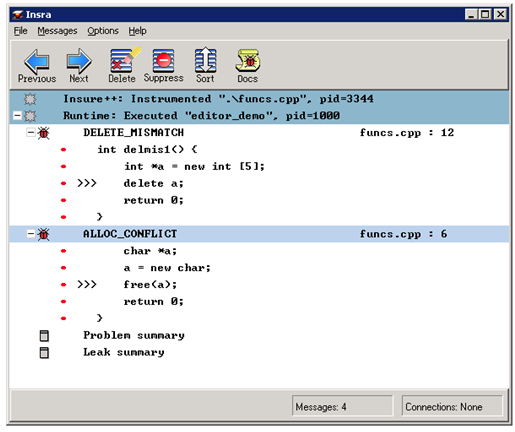
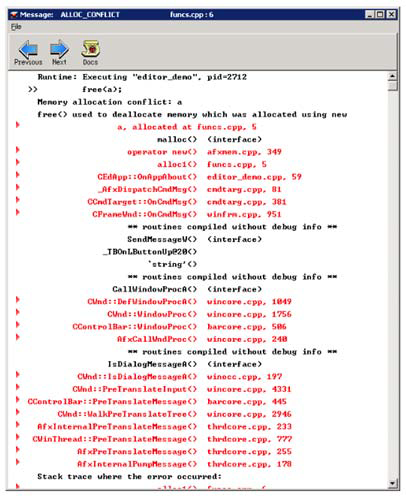
- Double-click an error message to launch a message window containing details about these errors, including a stack trace, as shown in the following graphic.
Example 2 - Checking an Entire Project for Runtime Errors
There will be times when you must check an entire project for runtime errors. This is a simple process that will find the most errors in your source code. To check the entire editor_demo project, follow these steps:
- Highlight the project in the Visual C++ workspace and click the Insure++ Rebuild All icon to make an instrumented build of the project with Insure++.
- Run the program by clicking the Insure++ Execute icon.
- Exercise the example application by performing the following steps:
- Click the New File icon
- Click the About (?) icon
- Exit the application.
- Review the output in Insra.
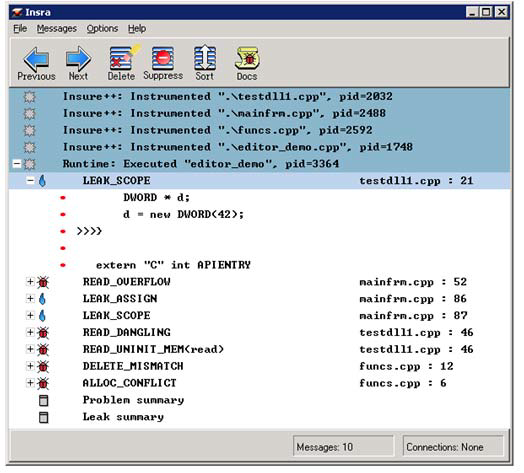
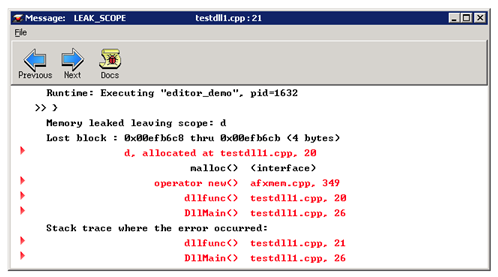
Many errors are found when analyzing the entire project. Double-click any error to view details in a message window. For instance, double-click the LEAK_SCOPE error to see where the memory was allocated and the exact line where the memory was leaked:
Example 3 - Finding Errors in DLLs in Non-Instrumented Executables
You can also use Insure++ to find errors in Dynamically Loaded Libraries (DLLs) that are loaded in non-instrumented executables. This is especially important if the DLL you’re developing is designed to be loaded into an executable that you don’t have the source for. The following steps demonstrate how to use Insure++ to perform a cursory check on a non-instrumented executable and a thorough check on an instrumented DLL.
- Configure the project so that testdll1.exe is no longer an explicit dependency of editor_demo.exe by choosing Project> Dependencies and disabling the option for testdll1.
- Click OK to save your change.
- Rebuild editor_demo.exe without instrumentation by going to the Build menu of Visual C++ and selecting Rebuild All (testdll1 should already be instrumented).
- With editor_demo as the current project, run the project under Insure++ again by clicking the Insure++ Execute icon.
- Exercise the example application by performing the following steps:
- Click the New File icon
- Click the About (?) icon
- Exit the application.
- Review the output in Insra.
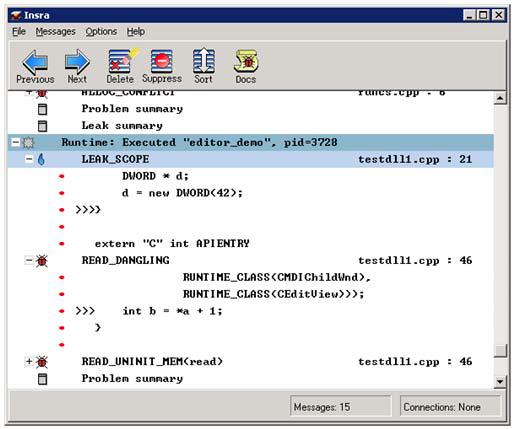
You should see the errors LEAK_SCOPE and READ_DANGLING for testdll1. Double-click any error message to examine the error more closely.