In this section:
Overview
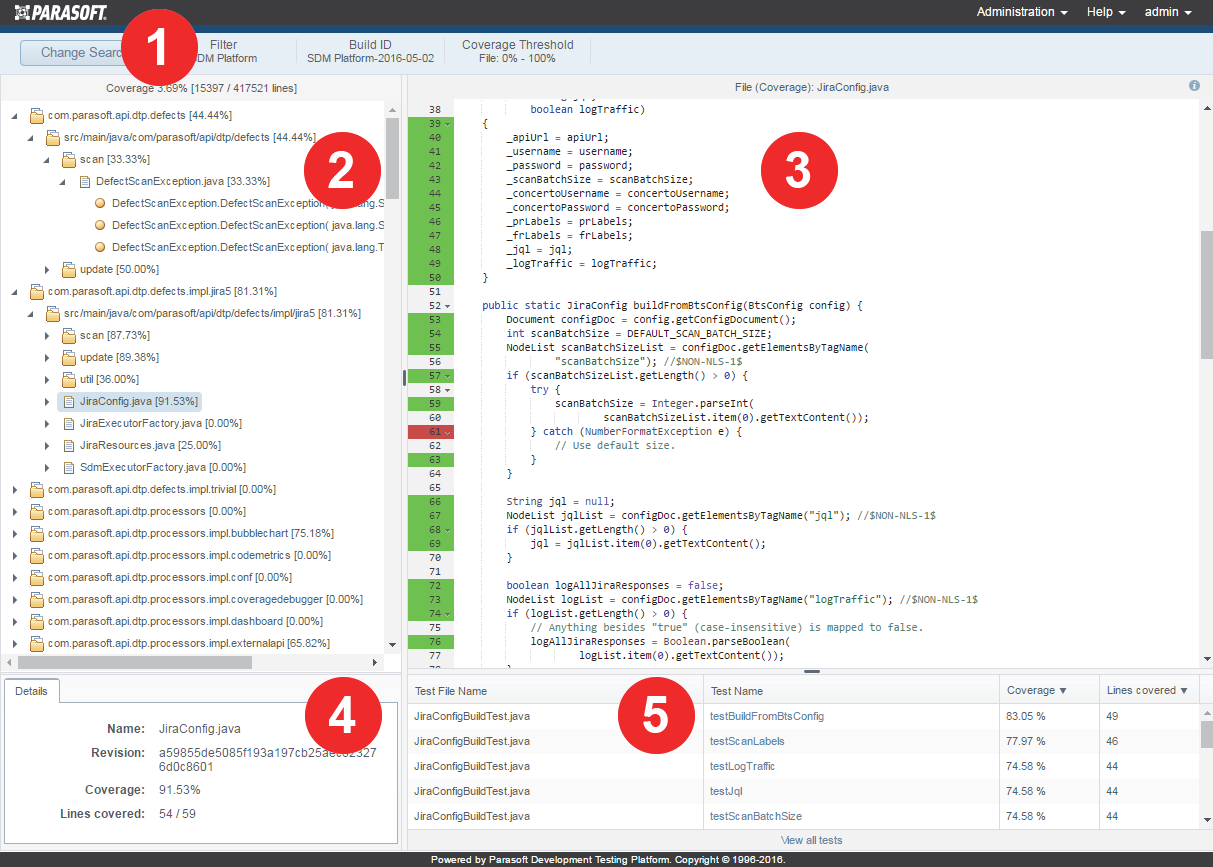
The Coverage Explorer allows you to navigate the source tree to see file- and method-level coverage information. Click on a coverage widget in the Report Center dashboard view to access the coverage explorer (see Widgets). The Coverage Explorer is divided into five sections:
- Search panel; see Using the Search Panel
- Coverage tree panel; see Navigating the Coverage Tree Panel
- Source panel; see Viewing Source Coverage
- Details panel; see Viewing Details
- Tests table; see Viewing Test Information
Using the Search Panel
The Coverage Explorer opens using the settings of the coverage widget you clicked as search parameters, but you can easily change the search to learn about the state of coverage in your application.
- Click Change Search to open the Search Options.
- Choose a filter from the Filter drop-down menu (see Creating and Managing Filters to learn more about filters in Report Center).
- Choose a build ID from the Build drop-down menu (see Build to learn more about build IDs).
- You can search by coverage threshold or by file name.
- To search for files or methods based on a coverage range:
- Click the Coverage option and use the slider to set the coverage range; for example, leave the lower threshold slider stop at 0% and slide the upper stop down to 50% to return files or methods that have 50% or lower coverage.
- Click Search.
- To search by filename:
- Click the File Name option and enter all or part of the filename in the search bar.
- Click Search.
The search results panel will be updated based onyour search parameters.
Navigating the Coverage Tree Panel
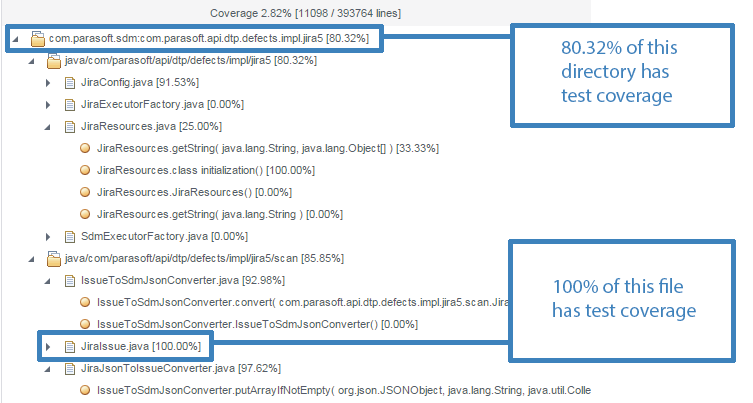
The coverage trees panel displays a hierarchical view of the files within the search parameters. Each node in the hierarchy shows how much of each file or directory is covered in brackets.
You can perform the following actions:
- Click on a disclosure triangle to navigate the tree.
- Click on a file or directory view the information about the file or directory in the details panel; see Viewing Details.
- Click on a file to view the contents in the source panel; see Viewing Source Coverage.
Viewing Source Coverage
Click on a file or function in the search results panel to view it in the source panel. You must have permissions to view source code in Report Center explorer views (see Assigning Native Permissions for additional information).
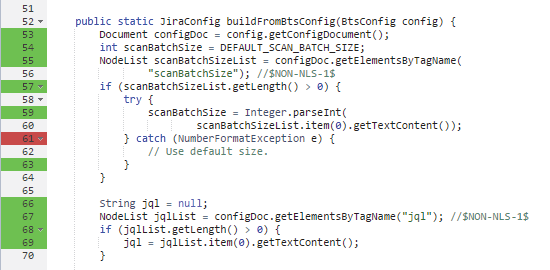
Line-by-line coverage information is color coded:
- green lines are lines that are covered with a test.
- red lines are not covered.
When you make a selection in the coverage tree panel, the file name and the component that opened the file appears in the code panel.
Viewing Details
The details panel shows information about the selected directory, file, function, or method selected in the search results panel.
Viewing Test Information
The test information table shows all the tests that covers one or more lines of the selected source code. Click on a file that contains covered functions to view test information.
You can perform the following actions:
- Click on a column header to sort the table
- Click on a test in the Test Name panel to view the test in the test explorer; see Test Explorer.
- Click the View all tests link to open all tests shows in the table in the test explorer; see Test Explorer.


