In this section:
Prerequisites
- Renesas RX 2.05
- The Parasoft C++test plugin for Eclipse
Integration Overview
The C++test plugin is integrated with e2 studio Eclipse IDE by means of the Eclipse plugin mechanism. When prompted to select the target platform, select the Other radio button and provide the path to the Eclipse folder within the e2 studio installation directory. Then continue the installation as normal.
Performing Unit Testing and Application Monitoring
Ensure that your project supports "Debug using Simulator". This can be verified by locating the "{project_name} Debug.launch" file at the top level of your project.
Eclipse Workspace Update
Collecting coverage information for unit tests requires registering extra debugger actions.
- In e2 studio, go to Window> Preferences> C/C++> Debug> GDB.
- Modify the value of GDB Command by browsing for the gdb script located in
<path_to_install_location>\engine\etc\templates\for_recipes\RenesasRxGDBinit.gdb - If a GDB Command is already specified, append the contents of the script from the above location to the script that is already registered.
The gdb script is set to exit the debugger at Excep_BRK(). If the program being executed halts in a different manner, modify the gdb script accordingly.
Updating Project Properties
Unit testing with C++test requires optimization be set to 0:
- Open the project properties and go to C/C++Build> Settings.
- Expand the submenu of the C and C++ Compiler and click Optimize.
- Select 0 in the Optimize level field.
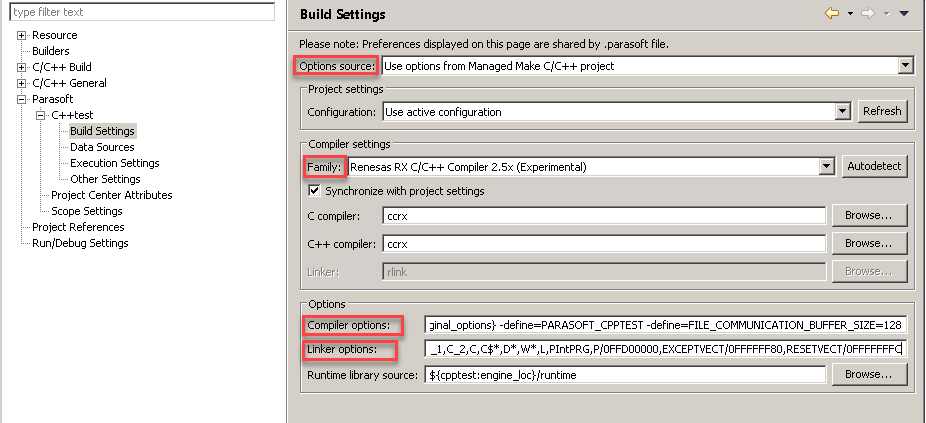
Open the project properties and go to Parasoft> C++test> Build Settings and configure the following options:
- Options source
Select Use Options from Managed Make C/C++ project from the drop down menu. - Compiler Settings
Select Renesas RX C/C++ Compiler 2.5x from the Family drop-down menu and click OK when prompted to confirm the changes. - Options
Set the Compiler options to${cpptest:original_options} -define=PARASOFT_CPPTEST -define=FILE_COMMUNICATION_BUFFER_SIZE=128.
Append Linker options with the start argument available in ${workspace_loc}\Debug\LinkerSubCommand.tmp. Your-startargument may resemble the following:-start=SU,SI,B_1,R_1,B_2,R_2,B,R/04,PResetPRG,C_1,C_2,C,C$*,D*,W*,L,PIntPRG,P/0FFD00000,EXCEPTVECT/0FFFFFF80,RESETVECT/0FFFFFFFC
Setting up an Instrumented Debug Launch Configuration
- Duplicate the default debug launch configuration. The new configuration will be placed at the top level directory of a new project created with e2 studio.
- Ensure that the duplicated configuration produces a debug executable that can be run with the debugger supplied with e2 studio.
- Rename the new debug launch configuration to indicate it can be used for unit testing with C++test.
- Customize the configuration.
In the Startup tab:
- Disable the Halt checkbox.
- Disable the Set breakpoint at checkbox.
- Enable the Resume checkbox.
In the Debugger> Debug Tool Settings tab:
- In the Memory section, click the ellipsis button in the Memory Areas row.
- Add a new Emulation ROM address space to the map of at least 1MB.
- Modify the start argument to use the start address of this new memory space fo the Program area {P}.
Example of start argument modification
For the new Simulator Memory Map Row:
| Emulation ROM | 0x01000000 | 0x01ffffff | 16384 KBytes |
The original project link command start argument:
-start=SU,SI,B_1,R_1,B_2,R_2,B,R/04,PResetPRG,C_1,C_2,C,C$*,D*,W*,L,PIntPRG,P/0FFFF0000,FIXEDVECT/0FFFFFF80
The Parasoft link options after update:
-start=SU,SI,B_1,R_1,B_2,R_2,B,R/04,PResetPRG,C_1,C_2,C,C$*,D*,W*,L,PIntPRG,P/001000000,FIXEDVECT/0FFFFFF80
It may be necessary to make room for more Uninitialized D
Allocating more space for uninitialized data
You may need to make more room for uninitialized data in the following cases:
- The amount of heap space of an instrumented executable exceeds the amount of RAM provided by default.
- The program fails to link due to errors stating that a given address overruns its given section.
To update the memory map, follow the steps from Setting up an Instrumented Debug Launch Configuration and add a new Emulation RAM section (instead of Emulation ROM).
For the new Simulator Memory Map Row:
| Emulation RAM | 0x02000000 | 0x02ffffff | 16384 KBytes |
Modify the start argument of the Parasoft linker options to reflect the new row in the memory map.
The original project link command start argument:
-start=SU,SI,B_1,R_1,B_2,R_2,B,R/04,PResetPRG,C_1,C_2,C,C$*,D*,W*,L,PIntPRG,P/001000000,FIXEDVECT/0FFFFFF80
The Parasoft link options after update:
-start=SU,SI,R_1,R_2,R/04,PResetPRG,C_1,C_2,C,C$*,D*,W*,L,PIntPRG,P/001000000,FIXEDVECT/0FFFFFF80,B_1,B_2,B/002000000
It may also be necessary to update the values for stack and heap size. They are defined by #define HEAPSIZE and #pragma stacksize su.
Example Workflow for setting up Application Monitoring
Exclude source files that contain system initialization or interrupt code from Parasoft instrumentation:
- Right-click one source file or a group of selected source files and go to Parasoft> C++test> Execution Settings... .
- Disable the Instrument selected source file(s) option in the dialog box.
The C++test execution flow for application monitoring needs to point to the customized launch configuration. To set up the configuration:
- Choose Parasoft in the IDE menu bar.
- Go to Test Configurations...> Builtin> Embedded Sysems> Renesas Rx.
- Duplicate the Build and Run Renesas Rx Application Monitoring Executable in e2 Studio configuration. The duplicated configuration will be displayed in the User-defined category.
- Open the duplicated configuration and click the Execution> Runtime tab.
- Enable the Run tests in debugger(*) checkbox.
- Enable the Use Eclipse internal debugger with configuration: option and select the new debug launch configuration from the drop-down menu.


