This topic explains C++test's reports. Two types of reports can be produced from the command line interface: manager reports and developer reports. C++test can also generate reports from GUI tests. The reports produced from GUI tests are similar to manager reports, and link to developer reports when appropriate.
Note that this topic explains common report contents. Report details will vary based on report settings, the Test Configuration used, and the errors found.
Sections include:
Manager (Comprehensive) Reports
Manager reports cover results for all team members. The manager report typically contains the following sections:
Header/Navigation Bar
The top left cell of the header/navigation bar shows the time and date of the test. The remaining cells (Metrics [if metric calculation was performed], Static Analysis, Test Generation, Test Execution) each link to the named report section.
Static Analysis Section
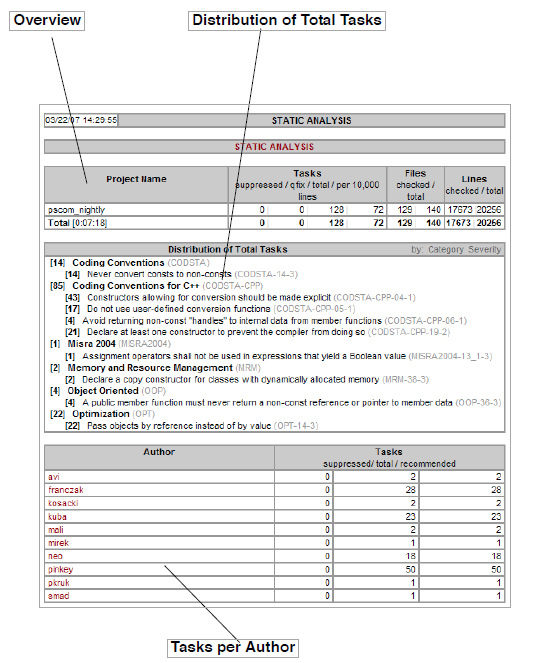
The Static Analysis section includes several items:
- The Static Analysis trends graph tracks how the total number of lines of code in the project, the lines of project code that were checked during static analysis, and the total number of reported static analysis tasks vary over time. This graph is created only for tests that are run from the command line and that use the
-publishteamservercommand. - The Overview table shows a basic summary of all static analysis tasks for the tested project(s). It reports the total number of static analysis tasks, the number files checked during static analysis, the total number of project files, the number of lines of code checked during static analysis, and the total number of lines of code in the project. It also reports the total time spent performing static analysis.
- The Distribution of Total Tasks table shows the total number of tasks reported for each static analysis rule category and rule. Tasks can be sorted by rule category or rule severity; click the appropriate link in the table header to change the table sorting.
- The Tasks per Author table shows the number of static analysis tasks that each developer is responsible for. It reports suppressed tasks, the delta total for tasks (the change in total tasks relative to the previous run), total tasks, and recommended tasks. To see details about the static analysis tasks that each developer is responsible for, click the username of that developer. This will open the Static Analysis section of the related developer report (described in Developer (Focused) Reports).
- If a team member’s name is listed in green, it means that there are no “recommended static analysis tasks" reported for that team member. "Recommended tasks" are the subset of all reported tasks that Parasoft Test has selected for that team member to review and address today. This is based on the maximum number of tasks per team member that your team has configured Parasoft Test to report, as described in Goals Tab Settings - Defining Error Reporting and Resolution Targets, and task assignment settings, as described in Configuring Task Assignment and Code Authorship Settings).
- If tests are being run on a regular basis (nightly, weekly, etc.) this table will also report the "delta total" for each author. This tells you the change in the total tasks relative to the previous test run (e.g., +2 or -5).
- The Task Details section provides details about each reported task.
- The Checked Files (Details) section lists all the files that were checked. For each file, it lists the number of rule violations and the number of suppressed violations. If the file has a violation, it also lists the line number, rule name, and rule ID for that violation.
- The Active Rules section lists the names and IDs of all rules that were enabled for the test.
Metrics Section
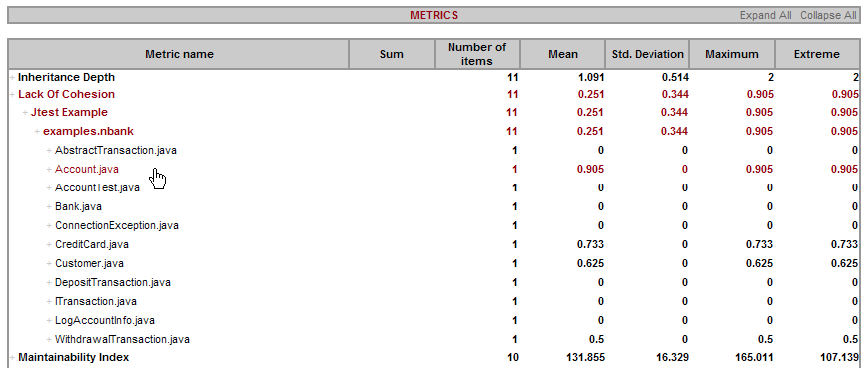
The Metrics section shows the results of your metrics analysis. Red indicates a metric that is out of the prescribed range. This section is only available if the Publish metrics statistics in reports option is enabled in the Test Configuration’s Static> Metrics tab.
Test Generation Section
The Test Generation section includes several items:
- The Overview table shows a basic summary of all test generation results for the tested project(s). It reports the number of checked files, test classes generated, and test cases generated. Additionally, it reports the total time spent performing test case generation.
- The Test Cases per Author table shows the number of test cases generated for each developer’s code. To see details about the test cases that were generated for each developer’s code, click the username of that developer. This will open the Test Case Generation section of the related developer report (described in Developer (Focused) Reports). For information on how Parasoft Test determines code authorship, see Configuring Task Assignment and Code Authorship Settings).
- If tests are being run on a regular basis (nightly, weekly, etc.) this table will also report the "delta total" for each author. This tells you the change in the total tasks relative to the previous test run (e.g., +2 or -5).
- If tests are being run on a regular basis (nightly, weekly, etc.) this table will also report the "delta total" for each author. This tells you the change in the total tasks relative to the previous test run (e.g., +2 or -5).
Test Execution Section
The Test Execution section includes several items:
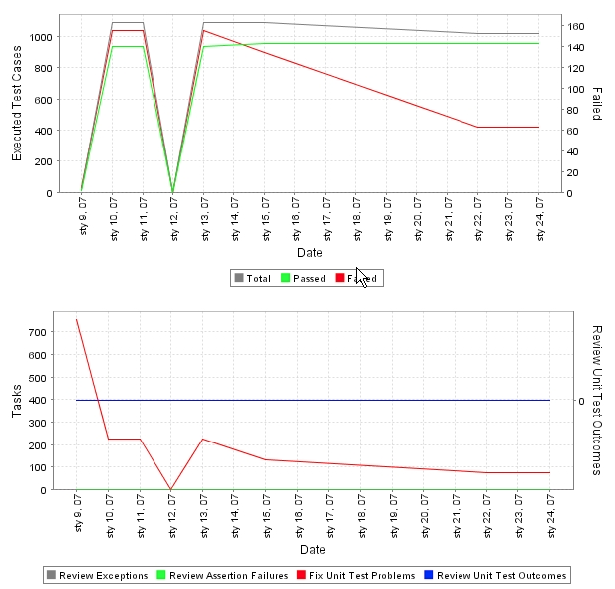
- The Test Execution Tasks trends graph tracks how the number of unit testing tasks—including problems, unverified failures/exceptions, and unverified outcomes—change over time. This graph is created only for tests that are run from the command line interface and that use the
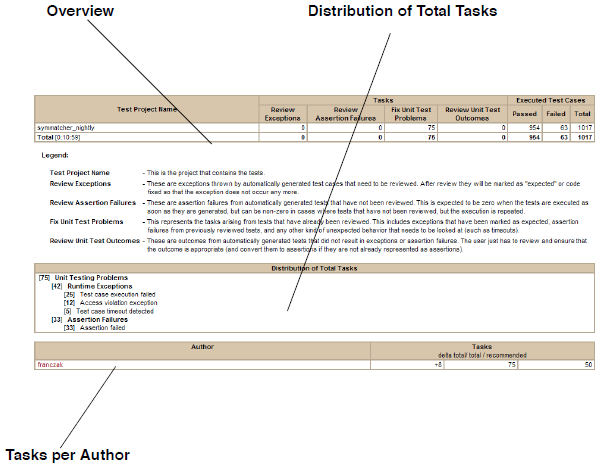
-publishteamservercommand. - The Overview table shows a basic summary of all test execution results for the tested project(s). It reports the number of tasks (by category), and the execution results (passed, failed, and total test cases). Note that Unverified Outcomes are considered as passed test cases.
- The Distribution of Total Tasks table shows the number of unit testing tasks reported in each category.
- The Tasks per Author table shows the number of unit testing tasks that each developer is responsible for. To see details about the unit test tasks that each developer is responsible for, click the username of that developer. This will open the Test Case Execution section of the related developer report (described in Developer (Focused) Reports).
- If a team member’s name is listed in green, it means that there are no “recommended unit testing tasks" reported for that team member. "Recommended tasks" are the sub-set of all reported tasks that Parasoft Test has selected for that team member to review and address today. This is based on the maximum number of tasks per team member that your team has configured Parasoft Test to report, as described in Goals Tab Settings - Defining Error Reporting and Resolution Targets, and task assignment settings, as described in Configuring Task Assignment and Code Authorship Settings).
- If tests are being run on a regular basis (nightly, weekly, etc.) this table will also report the "delta total" for each author. This tells you the change in the total tasks relative to the previous test run (e.g., +2 or -5).
- The Task Details section provides details about each reported task.
- The Coverage trends graph tracks how coverage metrics vary over time. This graph is created only for tests that are run from the command line interface and that use the
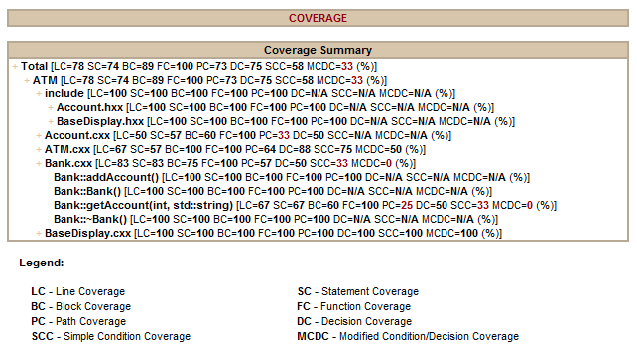
-publishteamservercommand. - The Coverage Summary table shows basic test coverage statistics. To drill-down, click the + links in the tree. To view a report that includes source code annotated with line-by-line coverage details, click the Coverage Summary link.
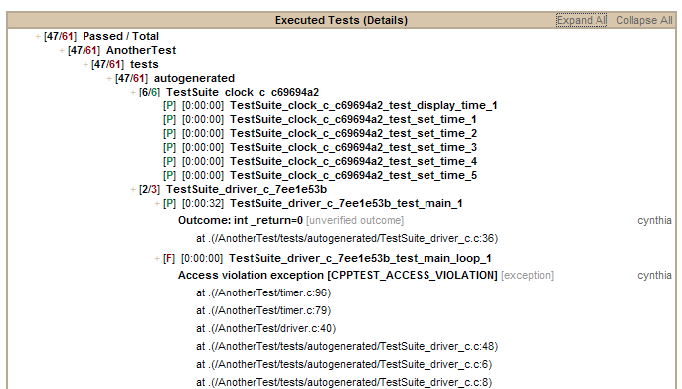
- The Executed Tests (Details) section lists all executed test cases and their outcomes (pass or fail). For each test suite, it lists the total number of test cases and the number of passed test cases. When appropriate options are selected to test cases are attached issue tracking tags details, and static details with dynamic details including passed/failed assertions parameters and comments from Report API.
Team Server Report Link
This link allows you to directly browse to this and other report files available on Team Server. In the reports available on Team Server, all links (for instance, links to Category) are active. All links are not active in emailed reports. Thus, if you want to explore an emailed report in more detail, we recommend that you follow this link and access the report on Team Server.
Developer (Focused) Reports
Developer reports cover only results that the named developer is responsible for. To learn more about how Parasoft Test determines which tasks are assigned to which developers, see Configuring Task Assignment and Code Authorship Settings).
Each developer report typically contains the following sections:
Header/Navigation Bar
The top left cell of the header/navigation bar shows the time and date of the test. The remaining cells (Static Analysis, Test Generation, Test Execution) each link to the named report section.
Static Analysis Section
The Static Analysis section includes several items:
- The Static Analysis trends graph tracks how the total number of static analysis tasks assigned to you each day changes over time. This graph is created only for tests that are run from the command line and that use the
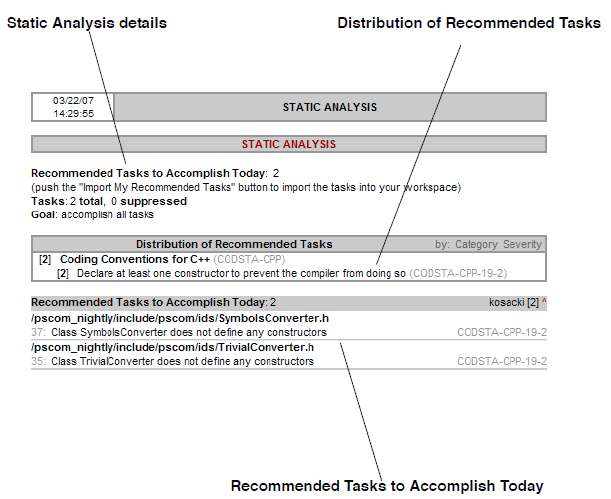
-publishteamservercommand. - Static Analysis details, including information about any static analysis goals set for the Test Configuration used to run the test, suppressed static analysis tasks, the total number of static analysis tasks that C++test identified, and the number of your "recommended tasks": the subset of all your static analysis tasks that C++test has selected for you to review and address today (based on the maximum number of tasks per developer that your team has configured C++test to report, as described in Goals Tab Settings - Defining Error Reporting and Resolution Targets). If the Test Configuration is not set to restrict the number of tasks per developer, all tasks found will be reported.
- The Distribution of Recommended Tasks table provides details about your recommended static analysis tasks. It shows the total number of tasks reported for each static analysis rule category and rule. Tasks can be sorted by rule category or rule severity; click the appropriate link in the table header to change the table sorting.
- The Recommended Tasks to Accomplish Today table provides details about your recommended static analysis tasks. Tasks are organized by file.
Test Execution Section
The Test Execution section includes several items:
- The Test Execution Tasks trends graph tracks how the number of unit testing tasks assigned to you—including problems, unverified failures/exceptions, and unverified outcomes—change over time. This graph is created only for tests that are run from the command line interface and that use the
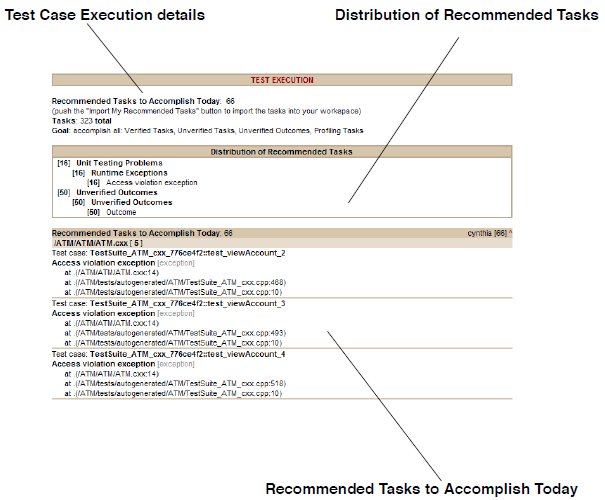
-publishteamservercommand. - Test Case Execution details, including information about any unit testing goals set for the Test Configuration used to run the test, the total number of unit testing tasks that C++test identified, and the number of your "recommended tasks": the subset of all your unit testing tasks that C++test has selected for you to review and accomplish today (based on the maximum number of tasks per developer that your team has configured C++test to report, as described in Goals Tab Settings - Defining Error Reporting and Resolution Targets). If the Test Configuration is not set to restrict the number of tasks per developer, all recommended tasks will be reported.
- The Distribution of Recommended Tasks table provides details about your recommended unit testing tasks. It shows the total number of tasks reported in each category.
- The Recommended Tasks to Accomplish Today table provides details about your recommended unit testing tasks. Tasks are organized by file.
- The Distribution of Total Tasks table provides details about all of the unit testing tasks that are assigned to you. It shows the total number of tasks reported in each category.
- The Total Tasks table provides details about all of the unit testing tasks that are assigned to you. Tasks are organized by file.
Team Server Report Link
This link allows you to directly browse to this and other report files available on Team Server. In the reports available on Team Server, all links (for instance, links to Category) are active. All links are not active in emailed reports. Thus, if you want to explore an emailed report in more detail, we recommend that you follow this link and access the report on Team Server.

