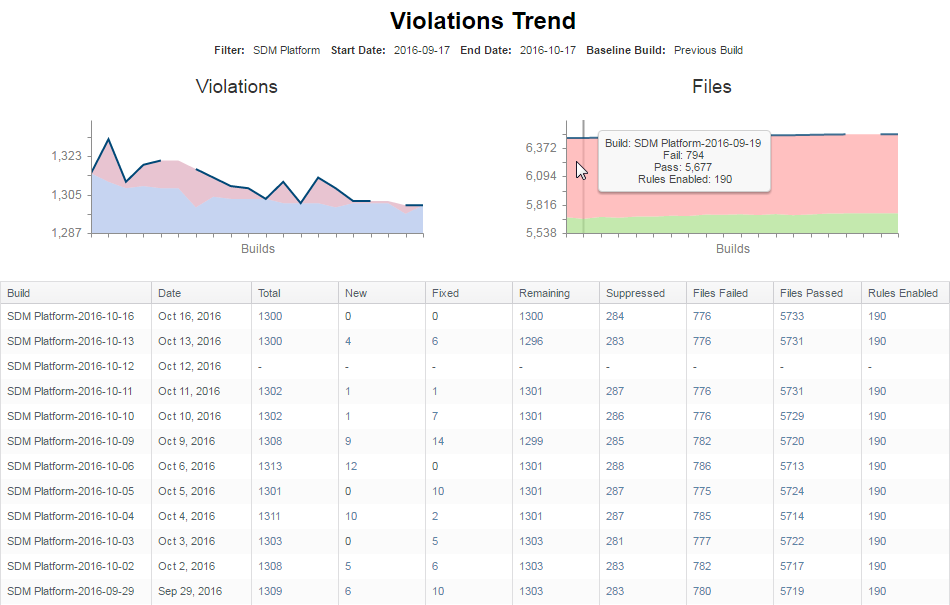
This report shows the change in violations reported by Parasoft code analysis and test execution tools over time per build. Click on a Violations Trend widget to open this report. See Static Analysis Widgets for additional information. The report contains the following sections:
Violations Graph
This graph shows the number of violations (x-axis) per build (y-axis) for the specified date range.
- The red area represents the number of new violations.
- The blue area represents the number of remaining violations.
- If build does not have violations trend data, the solid line along the top of the graph will have a gap.
- Mouse over an area in the graph to for the number of violations, as well as the number of rules enabled.
Files Graph
This graph shows the number of files (x-axis) per build (y-axis) for the specified date range.
- The red area represents the failed files (files containing violations).
- The green area represents the passed files (files with no violations).
- If build does not have passed/failed data, the solid line along the top of the graph will have a gap.
- Mouse over the line or area to view number of passed and failed files, as well as the number of rules enabled.
Details Table
This table shows specific information about each build represented in the report. You can perform the following actions:
- Click on a value in the Total column to open the Violations Explorer filtered to the selected build.
- Click on a value in the New column to view the violations associated with the the build tagged as new in the Violations Explorer.
- Click on a value in the Fixed column to view the violations associated with the the build tagged as fixed in the Violations Explorer.
- Click on a value in the Remaining column to view the violations associated with the the build tagged as existing violations in the Violations Explorer.
- Click on a value in the Suppressed column to view the violations associated with the the build tagged as suppressed in the Violations Explorer.
- Click on a value in the Files Failed column to open the All Violations drill-down report.
- Click on a value in the Files Passed column to open the Files Passed drill-down report.
- Click on a value in the Rules Enabled column to open the Violations Explorer.
All Violations
This report lists all violations for the specified date and filter grouped by file. Each entry shows the line number where the violation occurred, the violation message, severity of the violation, priority, author, and assignee. Click on a value in the Total column or the Files Failed column of the Violations Trend table to view the report.
You can perform the following actions:
- Click on a column header to sort the table
- Change the number of items per page.
- Click the next/previous buttons to progress through additional report pages if applicable.
Files Passed Report
This report shows a list of files that had no static analysis violations for the specified date and filter. Each entry includes the module containing the file and the source control branch (if known). Click on a value in the Files Passed column of the Violations Trend table to view the report.
You can perform the following actions:
- Click on a column header to sort the table
- Change the number of items per page.
- Click the next/previous buttons to progress through additional report pages if applicable.


