This topic explains how to perform load testing. In this section:
About Load Test Projects
Before you can start load testing, you need to create a load test project, which can be saved in a .lt file.
A load test project references either a SOAtest .tst file (which contains functional tests you want to load test and/or any existing load test configurations you want to import) or a jar file.
If the referenced .tst file or .jar file changes, those changes will be associated with the load test project as well.
- To save a load test project:Click the Save toolbar button, or choose File> Save / File> Save As.
To open a load test project:
- Choose File> Open.
Importing Existing SOAtest Load Tests
To import existing load tests from a SOAtest .tst file:
- Choose File> Open.
- Select the appropriate .tst file.
The load test configuration and functional tests will then be imported into Load Test. The load test project will be automatically configured as needed. The "component archive" type will be set to "Parasoft SOAtest Component", the .tst file from which the load test configuration was imported will be set as the current "SOAtest project" in the component configuration panel (available by selecting the main Profiles node), and the appropriate tests will be mapped to a profile.
You can select and run a load test scenario after opening such project. No additional configuration is required, but you are welcome to adjust the configuration as described in the following sections:
Importing Existing WebKing Load Tests
To import existing load tests from a WebKing .tst file:
- Import that .tst file into SOAtest (File> New> Project from Existing SOAtest or WebKing Test Suites).
- Open the Load Test perspective (Window> Open Perspective> Other> Parasoft Load Test).
- Configure and validate the test suite for load testing as described in the Load Testing section of the SOAtest User’s Guide.
- Open Parasoft Load Test
- Choose File> Open.
- Select the appropriate .tst file.
The load test configuration and functional tests will then be imported into Load Test. The load test project will be automatically configured as needed. The "component archive" type will be set to "Parasoft SOAtest Component", the .tst file from which the load test configuration was imported will be set as the current "SOAtest project" in the component configuration panel (available by selecting the main Profiles node), and the appropriate tests will be mapped to a profile.
You can select and run a load test scenario after opening such project. No additional configuration is required, but you are welcome to adjust the configuration as described in the following sections:
Creating Load Tests for SOAtest Functional Tests
Tutorial
For a demonstration of how to create load tests for service and web functional tests, see Creating and Performing a Load Test (for Web and/or Service Functional Tests).
To create load tests for a SOAtest functional test scenario:
- If the functional test scenario contains Web functional tests, configure and validate the test suite for load testing as described in the Load Test section of the SOAtest User’s Guide.
- In Parasoft Load Test, do one of the following:
- To create a new load test project:
- Choose File> New> Load Test Project or click the New Load Test toolbar button.
- Select SOAtest, then complete the Load Test Configuration wizard as described in Completing the Load Test Configuration Wizard.
- To add the functional tests to an existing load test project: Open that load test file (File> Open).
Important: Specify Which Functional Tests to Use for Load Testing
Before you can run the load test, you must first indicate which SOAtest functional tests should be used for load testing. You can do this in two places:
• In the Load Test Configuration wizard’s VU Profiles page.
• In one of the Profile> [Virtual User] configuration panels.
- To create a new load test project:
- (Optional) Select the top-level Profiles node in the Load Test tree, then customize environments, data source options, and setup/teardown options as needed.
- For details on environment configuration, see Configuring Setup/Teardown Test Execution.
- For details on data source options, see Configuring Data Source Usage.
- For details on setup/teardown options, see Configuring Setup/Teardown Test Execution.
- (Optional) Modify additional settings as needed. For details, see:
Creating Load Tests Driven by JUnit Tests
To create load tests driven by JUnit3 or JUnit4 tests available in a jar file:
- Do one of the following:
- To create a new load test project:
- Choose File> New> Load Test Project or click the New Load Test toolbar button.
- Select JUnit Runnable, then complete the Load Test Configuration wizard as described in Completing the Load Test Configuration Wizard.
- To add the JUnit-driven tests to an existing load test project: Open that load test file (File> Open).
- To create a new load test project:
- Select the top-level Profiles node in the Load Test tree, then complete that configuration panel:
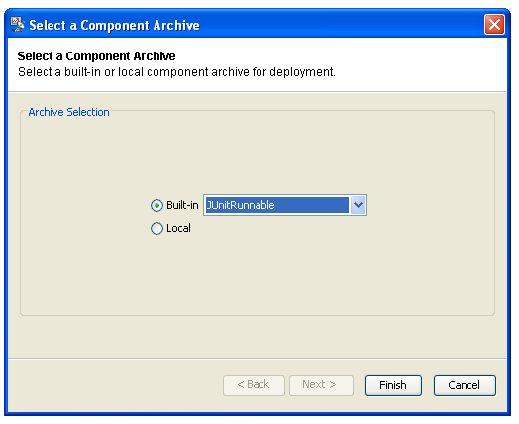
- Click Select.
- With the Built-in button selected, choose JUnit Runnable.
- Click Finish.
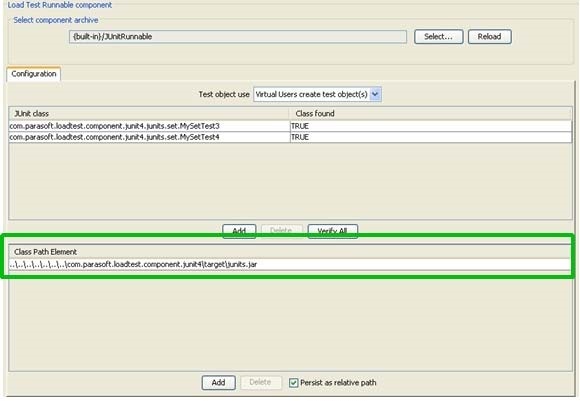
- In the configuration panel that opens, provide details about the JUnit tests you want to use:
- In the lower table, click Add then specify the JAR archives where Load Test should look for JUnit test classes and their dependencies.
- In the upper table, click Add then specify the JUnit test classes you want to use. After a JUnit class name is specified, Load Test checks if the class is present in the specified classpath elements. The Class found column of the class table displays whether the class is found.
- If classpath elements changed, you can click Verify All to re-check.
- In the Test object use box (towards the top of that same panel), choose the mode you want to use when load testing with these tests.
- Virtual users create test object(s): In this mode, each Virtual User creates an instance of a JUnit class. The Virtual User then executes the test methods of the JUnit class object according to the configuration of the Profile to which this Virtual User belongs. This mode is recommended if your JUnit methods test external objects or endpoints via Sockets or other remote object access.
- Virtual Users share test object(s): In this mode, all Virtual Users of a Load Test process share a single JUnit object. All Virtual Users will call methods of a single JUnit object. This mode can be used for concurrency testing of a JUnit object.
For instance you can write a JUnit class that tests manipulation of a MyCollection object that you wrote. You can test the MyCollection class for concurrency problems by load testing an appropriate JUnit test in this mode. In this case, as a rule of thumb, you should run the load test with the maximum number of Virtual Users or Hits Per Second that you can configure on your machine; this maximizes the level of concurrency with which you run the JUnit. Set the randomization type of your load test scenario to "Uniform".
- In the lower table, click Add then specify the JAR archives where Load Test should look for JUnit test classes and their dependencies.
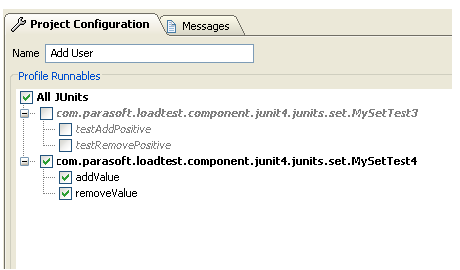
- Configure a new or default profile to run the desired operation from the jar file. See Customizing Profiles for details.
- For JUnit 3: All test* methods (methods starting with lower case ‘test’) can be selected.
- For JUnit4: You can select specific test methods that will be run by Virtual Users belonging to that profile. All methods with @Test (@org.junit.Test) annotation can be selected.
- (Optional) If you want to use setup and/or teardown methods, configure them as follows:
- For JUnit 3: JUnit 3 classes can have
setUp()andtearDown()methods that are run before and after test execution. These methods are called by Load Test’s JUnitRunnable component in the following manner (depending on the test execution mode):- In the Virtual Users create test object(s) mode: The
setUp()method of a JUnit object is called when a Virtual User is created. ThetearDown()method is called after a Virtual User ran all its scheduled tests and before it is destroyed. - In the Virtual Users share test object(s) mode: The
setUp()method of a JUnit object is called before the load test starts. ThetearDown()method is called after the load test has been stopped.
- In the Virtual Users create test object(s) mode: The
- For JUnit 4: JUnit 4 uses
@org.junit.Beforeand@org.junit.Afterannotations instead of thesetUp()andtearDown()naming conventions. Depending on the test execution mode,@Beforeand@Aftermethods of a JUnit4 test are called in the same manner as thesetUp()andtearDown()methods of a JUnit3 test (described above).
- For JUnit 3: JUnit 3 classes can have
- (Optional) Modify addition settings as needed. For details, see:
Reloading the Class Path Elements
If you changed any of the .jar class path elements, you need to reload the component for these changes to take effect. To do this, just click the Reload button.
Be sure to save your project before reloading the component; unsaved changes will be lost upon component reloading.
Creating Load Tests Driven by a Jar File
Tutorial
For a demonstration of how to create load tests driven by a jar file, see Creating Custom Load Test Components.
To create load tests driven by a custom component available in a jar file:
- Do one of the following:
- To create a new load test project:
- Choose File> New> Load Test Project or click the New Load Test toolbar button.
- Complete the Load Test Configuration wizard as described in Completing the Load Test Configuration Wizard.
- To add the jar-file-driven tests to an existing load test project: Open that load test file (File> Open).
- To create a new load test project:
- Select the Profiles node in the Load Test tree, then complete that configuration panel as follows:
- Click Select.
- Select the Local button.
- Click Next.
- Specify the appropriate JAR archive. Either select a built in component from the drop down list, or browse to a valid Parasoft Load Test .jar component archive.
- Click Finish.
- Configure a new or default profile to run the desired operation from the jar file. See Customizing Profiles for details.
- (Optional) Modify additional settings as needed. For details, see:
Depending on the component implementation, component-specific controls may display in the component configuration panel. For components that are not built-in, both the Deployment and Configuration tabs will be displayed. The Deployment tab will show component deployment properties such as the Java class name of the main component class as well as component validation messages.
Deployment details of a built in component can be viewed by choosing File> Customize Preferences, then opening the Components page in the Parasoft Load Test Preferences dialog.
Completing the Load Test Configuration Wizard
To use the load test configuration wizard:
- In the initial wizard panel, specify which .tst file contains the SOAtest tests you want to use for load testing, then click Next.
- If an existing load test configuration is detected in the specified .tst file, do one of the following:
- To use the existing configuration, select Existing Configuration and click Finish.
- To create a new configuration, select New Configuration and click Next.
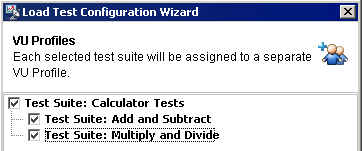
- In the VU Profiles panel (for SOAtest components only), select the check boxes that represent the test suites you want to use, then click Next.
- Each selected test suite will be assigned to a different virtual user profile.
- In the Schedule and Distribution panel, customize the available options as needed, then click Next.
- Controlled Parameter: If you want Load Test to try to achieve the specified virtual user quantities (and possibly vary the number of hits per second in the process), choose Number of Users. If you want Load Test to try to achieve the specified hit rates by varying the number of virtual users as needed, choose Hits per Second, Hits per Minute, Hits per Hour, or Hits per Day.
- Schedule: Type new values in the Duration fields. Days are limited to 30, hours are limited to 23, minutes are limited to 59, and seconds are limited to 59.
- Distribution: Select the type of distribution from the following options:
- The Linear Increase scenario simulates a load that increases linearly over time. This is useful for capacity testing, which helps you determine scalability.
- The Steady Load scenario simulates a steady load of users over time. This is useful for endurance testing, which helps you determine whether performance degrades over time.
- The Bell scenario simulates the typical daily user distribution (starts at the lowest point immediately after midnight, rises gradually in the morning, peaks towards the middle of the day, declines gradually in the afternoon, then returns to the lowest point at the end of the day). This is useful for expected usage testing, which determines whether performance problems occur with normal load patterns.
- The Buffer Test scenario simulates a variable load over time. This helps you determine whether resources are released when the load decreases. It also helps you determine whether overall performance degrades over time.
- In the Performance Monitors panel, configure performance monitors as needed, then click Next.
- For more information on performance monitors, see Adding Built-In Monitors.
- In the Quality of Service panel, customize the metrics as needed, then click Next.
- 100% Success: The measured percent of succeeding request messages must be exactly 100%.
- Fast Hit Rate: The throughput achieved during the load test must be above the defined level.
- Low Server Time: Verifies that the average server time is below the specified threshold.
- No Failures: The total number of failures occurring during the load test must be zero.
- Low Execution Time: Verifies that the average execution time is below the specified threshold.
For more information on Quality of Service, see Customizing QoS Metrics for Scenarios.
- In the Slave Machines panel, configure remote machines as needed, then click Next.
- You can add or remove remote machines, as well as select High Throughput to disable test response verification.
- For more information on slava machines, see Customizing QoS Metrics for Scenarios.
- In the Other Options panel, customize options as needed, then click Finish.
- Start Load Test immediately: Select this option to immediately begin load testing once the Finish button is clicked in the Load Test Configuration wizard.
- Record graph data and error details: Select this option to have Load Test create a detailed scenario report after the completion of a load test. For more information on detailed reports, see Detailed Reports. After selecting the Record graph data and error details checkbox, the following options are available:
- Record first: Select this radio button and enter a number in the text field to record the first number of error details you specify. The Record first option is useful in preventing the detailed report files to grow to unmanageable sizes if a large number of errors are produced. By default, the first 300 error details are recorded.
- Record all: Select this radio button to record all error details in the detailed report.
- Record individual hits: Select to record individual hits and to have Load Test create a histogram as part of the detailed report after completion of a load test. You will also have the option to display individual hits in graphical and table forms within the Detailed report.
If the Start Load Test immediately option was selected, Load Test will then run a load test based on the specified scenario settings as well as the related test suite profile settings and machine settings. If the Start Load Test immediately option was not selected, a Load Tests tab displays in the left GUI panel, but a load test will not be run.
Running a Load Test
Once you have a load test associated with a SOAtest .tst project or a jar file, you can load test using preset load test scenarios (bell curve, buffer test, linear increase, or steady load) or any custom scenarios you have created in Load Test.
If you have a project ready for load testing, the Load Test toolbar button will be enabled:
To run a load test, simply click the Load Test toolbar button, then complete the Confirm Scenario dialog box to indicate what scenario you want to use. Consider the following points when choosing a scenario:
- The Bell scenario simulates the typical daily user distribution (starts at the lowest point immediately after midnight, rises gradually in the morning, peaks towards the middle of the day, declines gradually in the afternoon, then returns to the lowest point at the end of the day). This is useful for expected usage testing, which determines whether performance problems occur with normal load patterns.
- The Buffer Test scenario simulates a variable load over time. This helps you determine whether resources are released when the load decreases. It also helps you determine whether overall performance degrades over time.
- The Linear Increase scenario simulates a load that increases linearly over time. This is useful for capacity testing, which helps you determine how scalability.
- The Steady Load scenario simulates a steady load of users over time. This is useful for endurance testing, which helps you determine whether performance degrades over time.
Load Test will then run a load test based on the specified scenario settings as well as the related virtual user profile settings and machine settings. If you have not customized the settings, Load Test will run the test on the local machine and create virtual users.
Tip: Stopping a Test
If you want to stop a test before the specified duration has elapsed, click the Stop toolbar button. Load Test will then stop generating virtual users and display the Stopping dialog box. If you do not take any further action, Load Test will allow each active virtual user to complete the test it is currently executing.
If you would rather have Load Test stop the test immediately, click the Force Stop button. Note that if you choose the force stop option, the results for the stopped virtual users will not be included in the main load test results and the load test results might become inaccurate or misleading.
Monitoring Test Progress
Load Test displays test progress data during and after a test. In addition, it displays test results after a test has completed.
Load Test records the following test progress details: Execution details, Execution state, and Load test errors.
Viewing Execution Details
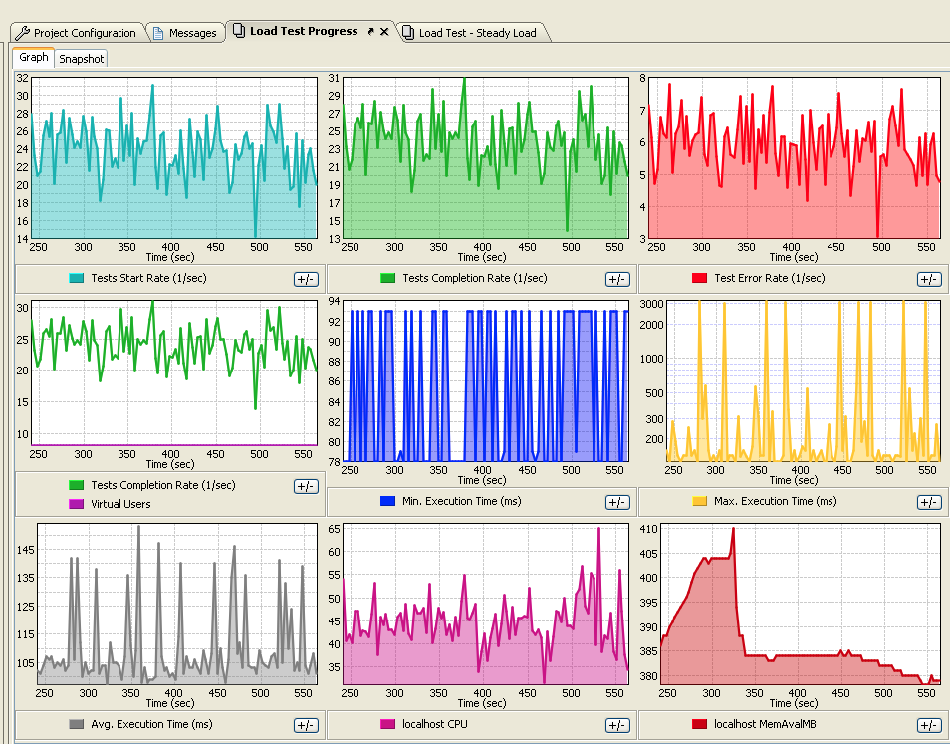
Immediately after a load test begins, the load test details display within the Graph tab in the Load Test Progress tab of the right GUI panel. This Graph tab allows you to view graphical data pertaining to the load test in progress.
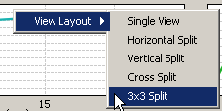
You can change the number and layout of graphs shown by right-clicking in the Graphs tab, then choosing one of the available layout options.
The following graphs display in the Graph tab legend:
- Tests Start Rate: Select to display the rate of the tests started over time in the graph.
- Tests Completion Rate: Select to display the rate of the tests completed over time in the graph.
- Test Error Rate: Select to display the rate of errors over time in the graph.
- Virtual Users: Select to display the number of virtual users over time in the graph.
- Min. Execution Time: Select to display the minimum execution time of the load test.
- Max. Execution Time: Select to display the maximum execution time of the load test.
- Avg. Execution Time: Select to display the average execution time of the load test.
- Monitor Parameters: Select to display data collected from any SNMP or Windows Monitors you added to the Monitors node of the Load Test tree. The names of the monitor parameters are based on the monitors’ Host and Graph Title values. In the above screenshot:
- The CPU graph shows percent CPU utilization of the local host.
- The MemAvailMB shows memory available on the local host in MB [mega bytes].
- For example, if you added a monitor and entered "
ox" for the Host, and "SNMP TCP Established" for a GraphTitle, you would see a graph for ox SNMP TCP Established in the Graph tab legend during load test progress. For more information on monitor parameters, see Using Monitors.
Customizing Execution Details
In addition to selecting from the options in the Graph tab legend, there are a variety of other ways for you to manipulate the details that display in the Graph tab while a load test is running:
To filter the graphical data displayed:
- Select from the drop-down menus located at the top of the Graph tab. Load test details that display in the Graph tab are filterable by Machines, Profiles, and Tests.
To change the report’s Y axis from the default linear scale to a logarithmic scale (or vice versa):
- If you want to use a logarithmic scale, check the Log Scale check box. A logarithmic scale allows you to see the shape of multiple curves on the same graph (even if the displayed values are very far from one another). For example, if the total loading time is between 1000 ms and 200 ms and the number of users is between 10 and 20, you will not be able to see the users values if the graph uses the linear scale (the graph will be a flat line close to 0). If you use a logarithmic scale, you will be able to see loading time values as well as the users values.
- If you want to use the linear scale, clear the Log Scale check box.
To fill in a graph area with its designated color, check the Fill graph areas check box.
To customize load test progress graph colors:
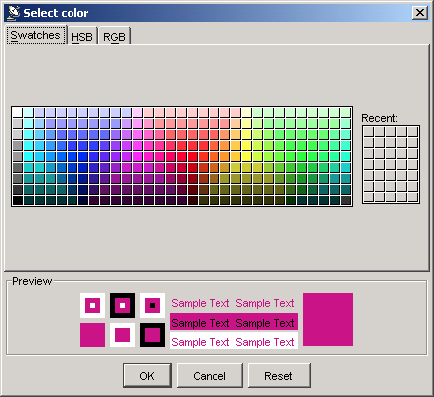
- Right-click the desired bar in the Graph tab legend and select ChangeColor from the shortcut menu. The Selectcolor dialog box opens.
- Manipulate the color scheme as needed in the dialog box and click OK.
To dynamically modify the virtual user count or profile weights while a load test is running:
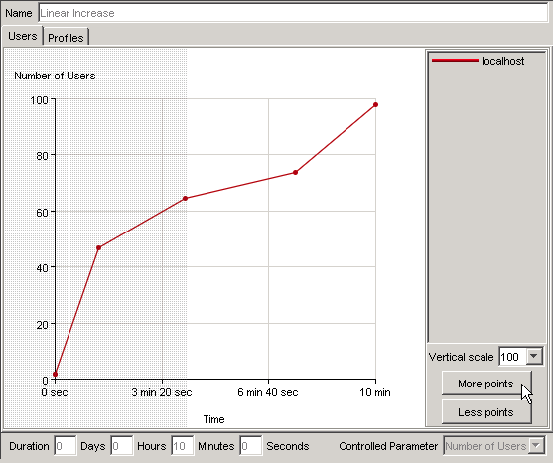
- Select the current scenario from the Scenarios node of the Load Tests tree. The Users and Profiles tabs display in the right GUI-panel with the Users tab selected.
The grayed-out sections of the tabs signify the elapsed time of the load test. You cannot modify any part of a graph curve that has been grayed-out. - Select the Users tab and modify the graph curve as needed by selecting from the Vertical scale drop-down menu, clicking the More points and Less points buttons, or by dragging and dropping the curve with your mouse. You cannot alter the duration of the load test while it is in progress.
- Select the Profiles tab and modify the graph curve as needed by selecting from the Vertical scale drop-down menu, clicking the More points and Less points buttons, or by dragging and dropping the curve(s) with your mouse. You cannot alter the duration of the load test while it is in progress.
For more information on customizing the Users or Profiles tabs, see Customizing Test Suite Scenarios - Return to the Load Test Progress graph by selecting Window> Load Test Progress.
To view execution details after the test has completed:
- Choose Window> Load Test Progress.
- Click the Graph tab.
Viewing Execution State
You can view execution state information (profile and current execution state) of the virtual users that were running at any time during test execution. The execution state information is updated every 3 seconds during test execution:
To view execution state information while the test is in progress:
- Click the Snapshot tab in the right GUI panel.
To view execution state information after the test has completed:
- Choose Window> Load Test Progress.
- Click the Snapshot tab.
Viewing Load Test Errors
If Load Test encounters errors during test execution (for example, if it cannot start testing on a remote machine because that machine is not running Load Test Server), it will display an orange exclamation point icon in the status bar.
To view the error message(s):
- Click the exclamation point icon.
Load Test also logs test execution errors in the Messages report. This option and report are only available if Load Test encountered errors during test execution. To view this report after the test has completed:
- Choose Messages in the load test report’s Views box.
In addition, you can view simulation details (for example, information about problems accessing remote test machines, interrupted threads, and so on) during or after test execution.
To view this information while the test is in progress:
- Click the Log tab in the right GUI panel.
To view simulation details after the test has completed,
- Choose Window> Load Test Progress.
- Click the Log tab.
Whenever the Log tab is open, you can set the log level (the warn setting is the most verbose; the error setting is the least verbose) and the buffer height for that console.
Working With Test Results
You can view load test results in the Load Test results window. For details on accessing and interpreting the available load test reports, see Reviewing and Customizing Load Test Results.
Configuring the JVM Garbage Collector and Memory Options
Load Test performance (and in some circumstances, the accuracy of time measurement) may depend on the JVM GC settings and the amount of memory available to the JVM.
It is recommended to have at least 4GB of system memory per Load Test process. The Load Test process JVM memory size is automatically configured by the Load Test launcher or script. To explicitly set the maximum amount of memory available to the JVM of a Load Test process, pass the -XmxNNNNM argument to the Load Test process from the command line, where the NNNN is the amount of memory in megabytes. On a Windows system, prepend –J before the argument; for example: “lt -J-Xmx4096M”.
For optimized performance, Parasoft Load Test uses the parallel young generation garbage collector specified by the JVM argument "-XX:+UseParallelGC". If necessary, this can be turned off with the command-line argument "-XX:-UseParallelGC". If you will be using this argument on a Windows system, prepend -J before the argument (following the name of the executable). For example: loadtest.exe -J-XX:-UseParallelGC.
