Accessing Dashboards
Click the Report Center menu to open the dashboard drawer.
- Click on a dashboard name to choose a dashboard.
- Click the Report Center menu button to close the dashboard drawer.
Filters
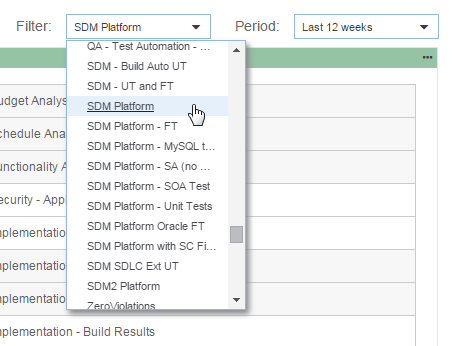
Filters organize the data Report Center displays from the DTP database. The dashboard filter controls the data presented in widgets unless a specific filter is set when the widget is created. See Adding Widgets. By default, filters are based on projects created in Project Center, but custom filters can be created in Report Center administration. Creating and Managing Filters. Click on the Filter drop-down menu to change filters:
Historical Data
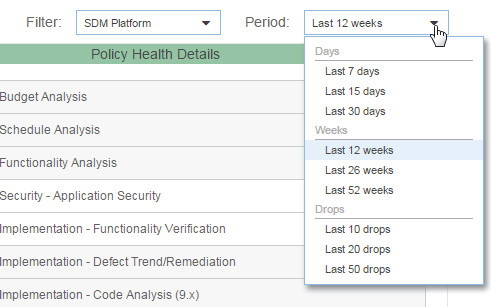
You can filter data per each dashboard based on time period, number of most recent drops, or specific date range. The historical filter can be set when adding new widgets. See Adding Widgets. Click the historical filter drop-down menu to set the time period or number of most recent drops:
Refreshing Dashboards
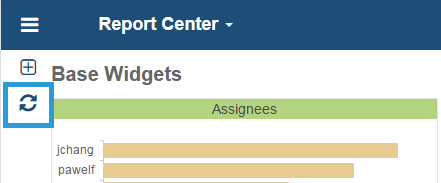
To ensure that you are viewing the most recent data in your dashboard, click the refresh button icon, which updates the dashboard without refreshing the entire page:
About the Dashboard Grid
The dashboard is six single-column widgets wide. The amount of vertical space is unlimited, but you should consider readability and usability when creating custom widgets that require a significant amount of space to display data.


