This topic explains how you can perform runtime monitoring of the application with C/C++test Plugin for Wind River Workbench 4.x. See Runtime Error Detection and Coverage Analysis for general information about application monitoring with C/C++test.
The following steps are required to perform the application monitoring with C/C++test Plugin for Wind River Workbench 4.x:

Configuring the Project
C/C++test Plugin for Wind River Workbench 4.x supports the following project types:
- Downloadable Kernel Module
- Real-Time Process
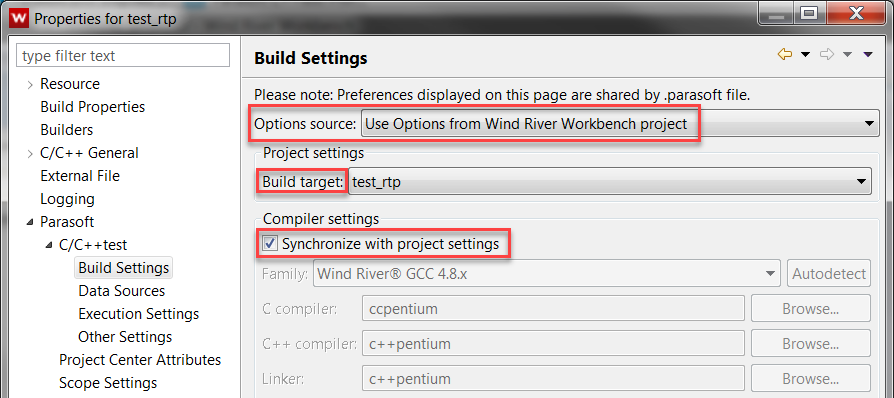
Before test execution, be sure that your project can be built in Wind River Workbench and is properly configured. Open the Properties of the project, go to Parasoft > C/C++test > Build Settings and ensure that the following options are configured:
- The Use Options from Wind River Workbench project option is selected from the Option source drop-down menu.
- The Build target option is properly set.
- The Synchronize with project settings option is enabled.

 The compiler family and executables are automatically set during during the first analysis run.
Configuring the Execution Environment for Test Automation
Before test execution, be sure that your project can be successfully run in your execution environment (Simulator or Target) and is properly configured.
- Ensure that the Debug Agent is enabled in your VxWorks runtime environment.
- Ensure that the Debug Agent target address matches the target address specified in the test configuration.
 The default target address used by C/C++test is
 127.0.0.1:60000. You can customize the target address in the test configuration (see Customizing the Test Configuration).
 Avoid using network port auto-mapping for the Debug Agent. You can specify a fixed Debug Agent local port when configuring VxWorks Simulator. Go to Advanced > Network Config > Configure... and add a new Port Mapping for debug_agent: Remote Port: 1534 > Local Port: 60000.
 - Ensure that the file system with the host-target path mapping (such as HostFS, PassFS) is available in your VxWorks runtime environment.
 By default, C/C++test uses the automatically detected host-target mapping when collecting test and coverage results. You can customize the mapping in the test configuration (see Customizing the Test Configuration).
 Customizing the Test Configuration
To review or modify the configuration settings for your execution environment:
- Open Parasoft > Test Configurations in your IDE menu.
- Go to Builtin > Embedded Systems > Wind River > Workbench 4.
- Depending on your project type, right-click one of the following test configurations and choose Duplicate:
- Run VxWorks DKM Application with Full Monitoring (File System, WRWB 4.x) for DKM projects
- Run VxWorks RTP Application with Full Monitoring (File System, WRWB 4.x) for RTP projects. - Select the duplicated test configuration, which will be added to the User-defined category.

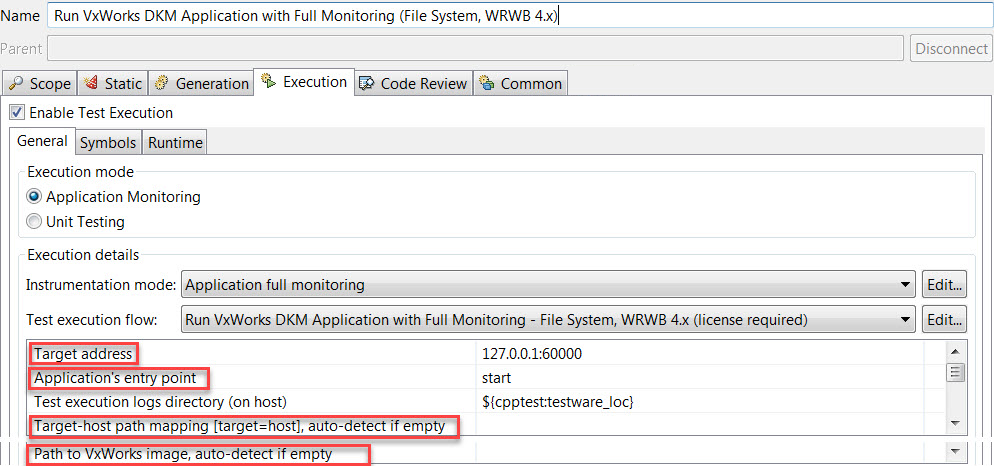
- Go to Execution > General > Execution details and review or modify the following settings:
- Target address - Specifies the target address (host:port); the default value is 127.0.0.1:60000. Be sure the address matches the settings of your VxWorks Simulator or Running Target.
- Target-host path mapping - Specifies path mapping between the target and the host (/target/path=/host/path). The mapping is used by C/C++test to store and access test and coverage log files.  The mapping must include the host location specified in "Test execution logs directory (on host)". By default, C/C++test auto-detects and uses available mappings provided by the Debug Agent.
- Application's entry point (DKM projects only) - Specifies the entry point function that will be automatically called after the binary is loaded into the target. See Building a Test Binary for Manual Test Execution for information about manually controlling the test binary (including the entry point).
- Path to VxWorks image (DKM projects only) - Specifies the path to the VxWorks image that is used to extract information about available symbols (required for correctly configuring stubs). If you use VxWorks Simulator, C/C++test automatically detects the VxWorks image. If you connect to Running Target, you must manually provide the path to the image.  Be sure to use Unix-style path separators (
c:/path/to/vxworks/image).

Building and Running the Test Application
Ensure your VxWorks Simulator or Running Target is connected. |
- Select the project you want to test.
- Depending on your project type, run one of the following test configurations:
- Run VxWorks DKM Application with Full Monitoring (File System, WRWB 4.x) for DKM projects
- Run VxWorks RTP Application with Full Monitoring (File System, WRWB 4.x) for RTP projects.
See Running a Test Configuration for information about running test configurations.
C/C++test will automatically:
- instrument the code
- build the test binary
- load the binary into the target (using the Debug Agent)
- unload the binary from the target (using Debug Agent)
- collect coverage and runtime monitoring results (using the Debug Agent / host-target path mapping)
 Building a Test Binary for Manual Test Execution (DKM projects only)
By default, C/C++test automatically builds and runs the test binary. If you need to manually execute a set of functional tests with the DKM binary, you can configure C/C++test to only build the test binary–without running it automatically. This allows you to manually upload the test binary to the target, execute your tests, and load the coverage data and runtime monitoring results into your Workbench IDE.
To manually execute tests for the DKM test binary:
- Duplicate the Run VxWorks DKM Application with Full Monitoring (File System, WRWB 4.x) test configuration.
- Rename the new test configuration (for example, as "VxWorks DKM build only").
- Go to Execution > General > Execution details > Test execution flow, select from the drop-down menu and click Apply.
- (Optional) Go to Execution > General > Execution Details > Test module binary and customize the location where the test binary will be saved.
- In the Project Explorer, select the DKM project you want to test.
- Run the duplicated test configuration.
C/C++test will automatically:
- instrument the code
- build the test binary.
- Manually load the test binary into the target.
- In the target console, call CppTest_InitializeRuntime to initialize the runtime application monitoring.
- Manually execute your tests using the test binary.
- In the target console, call CppTest_FinalizeRuntime to finalize the runtime application monitoring.
- Manually unload the test binary from the target.
- Run the Builtin > Utilities > Load Test Results (Files) test configuration to load the coverage and runtime monitoring results.
Reviewing the Results
When the test execution is completed, you can review:

The compiler family and executables are automatically set during during the first analysis run.

