This topic explains how to configure monitoring for events that occur on Parasoft Virtualize Servers.
Sections include:

Why Monitor Server Events?
Visibility into what messages are sent to and from Parasoft Virtualize Servers—and what validations and errors occur at the virtual asset level—enables you to:
- Validate the messages that are sent to your Parasoft servers and the virtual assets deployed on them.
- See what errors occur.
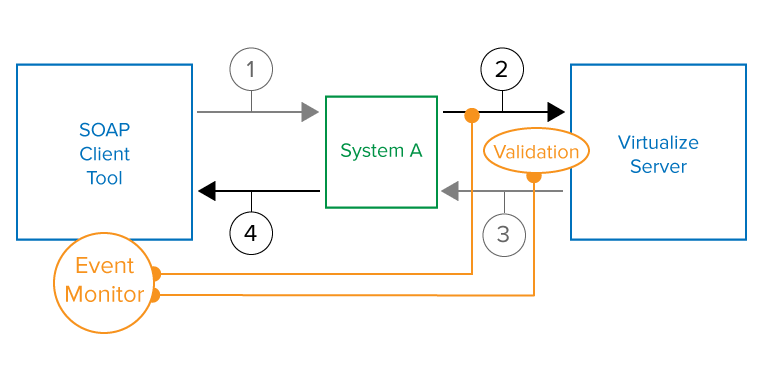
For example, in a common test situation, SOAtest will send a message to a system, such as an available service or a web browser, which will then send a message to a virtual asset deployed on a Parasoft Virtualize server (e.g., because the actual resources is not yet available or is not accessible for testing).

By adding an Event Monitor tool to the test suite, you gain insight into messages 2 and 3 and well as messages 1 and 4. You also see the result of any validation tools you may have attached to the virtual asset (for instance, XML Assertor tools) and receive details on any errors that may have occurred (for instance, because the virtual asset was not properly configured to process valid messages, or because invalid messages were sent).
Configuration
- Add an Event Monitor tool to the test suite that drives the interaction with the Virtualize Server you want to monitor.
- In the Event Source tab of the Event Monitor tool’s configuration panel, select Virtualize Server as the platform.
- (If you are connecting to a Virtualize Server that is version 9.6 or newer AND requires user authentication) In the Event Monitor tool configuration panel, complete the User and Password fields to the right of the Automatic option. Also, adjust settings for SSL, Host, and Port if needed.

- (If you are connecting to a Virtualize Server that is version 9.3 or older AND uses a port other than 1080) In the Event Monitor tool configuration panel:
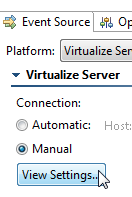
- Set connection to Manual
- Click View Settings.

- Provide OpenJMS connection settings as follows:
- URL:rmi://hostname:portnumber/
- Initial Context: org.exolab.jms.jndi.InitialContextFactory
- Connection Factory: ConnectionFactory
- Destination Name: SOATESTSERVER_STUB_EVENTS
- Destination Type: Topic
- Under Event Subscriptions, specify what type of events you want to monitor. Available options are:
- Request messages: The message sent to a virtual asset. For instance, in the image shown in Why Monitor Events?, this would be message #2.
- Response messages: The message that the virtual asset returns. For instance, in the image shown in Why Monitor Events?, this would be message #3.
- Message validation results: The result of any validation tools you may have attached to the virtual asset—such as XML Assertor tools. For instance, in the image shown in Why Monitor Events?, this would be whatever tool is represented by the "validation" marker.
- Errors events: Any errors that may have occurred (e.g., because virtual asset were not properly configured to process valid messages, or because invalid messages were sent). For instance, in the image shown in Why Monitor Events?, if the virtual asset was not configured to route message #2 to a specific responder, this would be reported as an error. This also includes events from custom extentions that are designated to be at the INFO level.
- Info events: Informational events, such as server startup and shutdown events as well as events from custom extentions that are designated to be at the INFO level.
- Debug events: Events from custom extensions that are designated to be at the DEBUG level.
- Warn events: Events from custom extensions that are designated to be at the WARN level.
- Under Test Failure Criteria, specify the test failure criteria. Note that if a validation tool is chained to the current Event Monitor tool, the outcome of that validation will determine this test’s success or failure—and the following settings not applicable. Available options include:
- Error events: The test will fail if any errors occur (e.g., because responders were not properly configured to process valid messages, or because invalid messages were sent).
- Validation failure events: The test will fail if a failure is reported by any validation tool (such as an XML Assertor tool) you may have attached to a responder.
- No events received: The test will fail if the virtual asset does not receive any events before the current test suite (the one that includes the Event Monitor tool) completes execution.
- In the Options tab, modify settings as needed.
- Clear the event viewer before each event monitor run determines whether SOAtest automatically clears the Event Monitor event view (both text and graphical) whenever Event Monitor starts monitoring.
- Include test execution events in the XML eventoutput specifies whether the Event Viewer tab and XML output display show only the monitored messages and events, or if they also indicate when each test started and completed. Enabling this option is helpful if you have multiple tests in the test suite and you want to better identify the events and correlate them to your test executions.
- Wrap monitored messages with CDATA to ensure well-formedness of the XML event output should be disabled if you expect the monitored events’ message content to be well-formed XML. This will make the messages inside the events accessible via XPaths, allowing the message contents to be extracted by XML Transformer or validated with XML Assertor tools.
- If the message contents are not necessarily XML, you should enable this option to ensure that the XML output of the Event Monitor tool (i.e. the XML Event Output for chaining tools to the Event Monitor, not what is shown under the Event Viewer) is well-formed XML by escaping all the message contents. This will make the content of these messages inaccessible by XPath since the message technically becomes just string content for the parent element.
- Note that the Diff tool’s XML mode supports string content that is XML. In other words, no matter which option you select here, the Diff tool will still be able to diff the messages as XML, including the ability to use XPaths for ignoring values.
- Maximum monitor execution duration specifies the point at which the test should timeout—in case another test in the test suite hangs, or if no other tests are being run (e.g., if you execute the Event Monitor test apart from the test suite, then use a custom application to send messages to system).
- Event polling delay after each test finishes execution (milliseconds) is not applicable here.
- The Event Viewer tab will display details about the events received. It indicates the virtual asset name, the name of responder that processed that message, the response message, results of validation tools (if available), and errors that occurred. Double-clicking an item opens a dialog with additional details.
Troubleshooting: No Events or Specific Error Messages are Reported
If you no events or specific error messages are reported by Event Monitor, then disable your firewall. Firewalls running where SOAtest is running can sometimes block communication between the Event Monitor and a remote Virtualize Server. If you are using the Windows firewall, it needs to be disabled prior to using Event Monitor with a remote Virtualize Server. Other firewalls may also need to be disabled.
 Using an Alternative JMS System for Virtualize Server Event Monitoring
By default, Virtualize Server events are monitored using the built-in ActiveMQ-based provider. Alternatively, you can use another JMS system that you have. To configure this:
- Open the view for the Parasoft Server you want to monitor (e.g. for a Parasoft Virtualize server, go to Parasoft Virtualize, and choose Window> Show View> Virtualize Server).
- Double-click the node for the machine (local or remote) you want to configure to use the event monitoring provider.
- In the Event Monitoring Provider field, select your preferred server. If you want to use a JMS server that is not specifically listed, choose Other JMS Provider.
Specify the connection settings.
Note that a default event monitoring destination and type are specified in the available controls. You need to either: - Configure your JMS system to use this default destination, or - Change the Parasoft settings to another destination that is available on your system. |
- In the Event Monitor tool configuration panel:
- Open the Event Source tab.
- Set connection to Manual
- Click View Settings.

- Select the appropriate Event Monitoring Provider.
- Specify the settings required to connect to your JMS.
For details on the connection settings, see


