This tutorial demonstrates how to use Load Test to test service and Web interface functional tests. In this section:
Tutorial Overview
Once functional tests have been created in SOAtest, the next step is load testing with Parasoft Load Test. Load testing allows you to emulate conditions of heavy usage, which can expose bugs that may only surface under these conditions. You can load test Web, SOA, and combined end-to-end tests (test scenarios that extend beyond the message layer through Web services, JMS, web interface, database, and so on).
In addition, Parasoft Load Test includes a framework for load testing any component that implements the Parasoft load test component API; for example, it can allow performance and concurrency testing of JUnits or load testing with lightweight Socket-based components that implement the Parasoft component API. This allows the load test to be specialized and tailored for the various unique complexities that organizations face in performing performance validation.
If you have load tests configured in previous versions of SOAtest, they can be imported and are fully supported.
Parasoft Load Test allows you to have full control over all aspects of the load testing process including the following areas:
- Enslaving Multiple Machines (Clustering): You can enslave multiple machines (running Load Test) on your network to generate larger amounts of load than what a single machine can generate. Click on the Machines folder in the load test window and explore the GUI that appears. For each machine, you have the option for High Throughput mode, which generates higher load intensities using the same hardware by disabling certain response processing operations. See Running Load Tests on Remote Machines for details.
- User Profiles: Creating user profiles allows you to directly relate your load test back to your functional tests. This means that once you have created your functional tests, no further work is required to begin running it under load. Double-click the Profiles folder in the load test window and view each of the profiles that have been created.
- Custom Scenarios: Load Test provides four default load testing scenarios (Bell, Buffer Test, Linear Increase, and Steady Load) or allows you to create your own custom scenario. These scenarios can be created to emulate possible real-life scenarios that may occur during normal usage. Click on the Scenarios folder and view the scenarios that are provided for this example.
- Monitors: Monitors can be added to Load Test to monitor various system resources as your load test occurs. Right-click on the Monitors folder to view the monitors that are available to be added. Load Test supports SNMP, Windows Perfmon, and JMX monitors. See Using Monitors for details.
Video Tutorial: Configuring and Running Load Tests Using Existing SOAtest Scenarios
Common Workflow for Test Scenarios that Include Web Functional Tests
The typical workflow for load testing any SOAtest functional test suite that includes Web functional tests is:
- Record a web scenario using a browser.
- Customize the test scenario with the desired validations and extractions.
- Switch to the Load Test perspective in SOAtest.
- Select the appropriate test suite in the Load Test Explorer and click Validate for Load Testing on the tool bar.
- If the execution succeeds, it is likely that no further scenario configuration/adjustment is needed and your scenario is ready for load testing by Parasoft Load Test.
- If the execution fails, then you can use SOAtest to configure your test suite so that it is ready for load testing. For instance, configuration might be required for variable URL parameter values that are passed across user actions within a certain browser scenario. For more details, see the Load Testing section of the SOAtest User’s Guide.
- Start Parasoft Load Test and create a new load test scenario for the .tst file that you created in SOAtest.
This same workflow applies to end-to-end test SOAtest test scenarios (test scenarios that extend beyond the message layer through Web services, JMS, web interface, database, etc.). Parasoft Load Test will drive concurrency out of any tests you may have in your SOAtest functional test suites.
Common Workflow for All Other SOAtest Test Scenarios
The typical workflow for load testing any SOAtest functional test suite that DOES NOT include Web functional tests is as follows:
- Define and customize the scenario in SOAtest.
- Start Parasoft Load Test and create a new load test scenario for the .tst file that you created in SOAtest.
Creating a Web Application Functional Test
In this tutorial we are going to use the ParaBank demo web application. Refer to Setting Up ParaBank for instructions on how to deploy a local instance of ParaBank.
Before you begin this lesson, we recommend that you follow the Web Functional Testing section in the SOAtest tutorial to learn how to record browser test suites for use in Load Test.
Recording a New Web Scenario
To record a Web functional test that we will use for load testing:
- In SOAtest, go to File > New > Test (.tst) file.
- Enter
ParaBankin the File name field and click Next. - Choose Web > Record web scenario and click Next.
- Choose Record new web scenario and click Next.
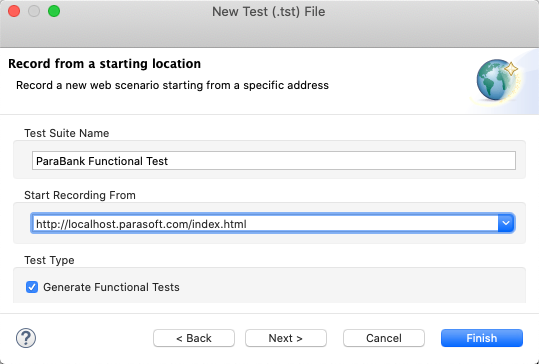
- Complete the Record from a starting location wizard as follows and click Finish:
- Enter
ParaBank Functional Testin the Test Suite Name field. - Enter
http://localhost.parasoft.com/index.htmlin the Start Recording From field.
- Enter
- The test will begin, then a browser window will open. Perform the following actions in the ParaBank application:
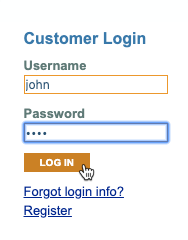
- Log into ParaBank with
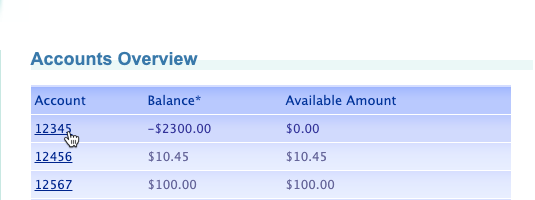
johnas the username anddemofor the password - Click the link for the first account listed.
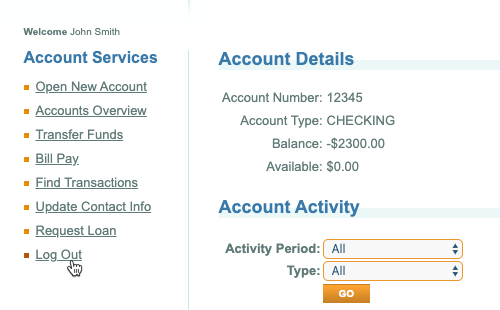
- Log out of the application and close the browser to conclude the recording session.
- Log into ParaBank with
Validating the Scenario for Load Testing
To validate that the test is ready for load testing:
- Switch SOAtest to the Load Test perspective by choosing Window > Open Perspective > Other > Parasoft Load Test. This will open a Load Test Explorer on the left. This is similar to the Test Case Explorer, but double clicking on each browser test case will open a special editor designed for preparing the test case step for load testing. This editor displays the various request URLs that are made by the browser to load that Web page, and any parameterized values used in these requests.
- Select the root ParaBank Test Suite node and click Validate for Load Testing on the tool bar. For this example, the tests should succeed, indicating that the functional web scenario is ready for load testing.
You can now configure and perform the load test as described in Creating and Performing a Load Test (for Web and/or Service Functional Tests).
Creating a Service Functional Test
Before you start, we recommend that you follow the SOAtest "Functional Testing" and "Scenario Testing" tutorials in the SOAtest User’s Guide.
To demonstrate load testing, we will use the test suites from the SOAtest tutorial. If the tutorial lessons are not already available in your SOAtest workspace, create them as follows:
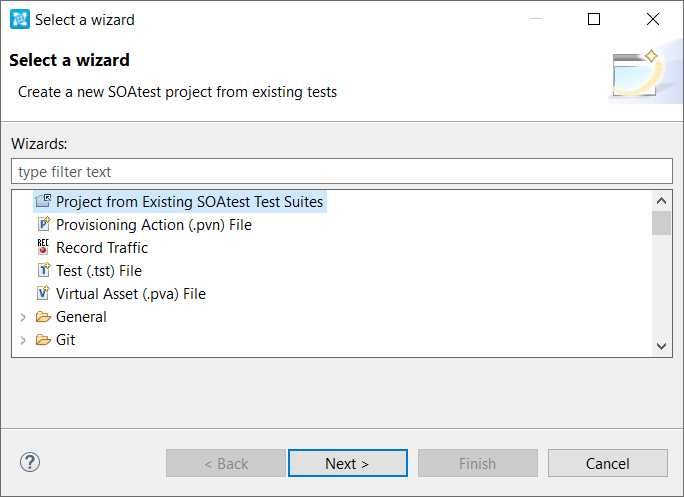
- In SOAtest, go to File > New > Other and choose Project from Existing SOAtest Test Suites.
- Click Next.
- Enter
Examplesin the Project Name field. - Under Directory, specify the location of the project’s test suites by clicking Browse then navigating to
<SOAtest/Load_Test_installation_directory>/examples/tests. - Click Finish. The Examples project will be added to the Test Case Explorer. It will contain multiple test (.tst) files.
You can now configure and perform the load test as described in Creating and Performing a Load Test (for Web and/or Service Functional Tests).
Creating and Performing a Load Test (for Web and/or Service Functional Tests)
To define and run a load test for either the Web or Service tests referenced in the previous exercises:
- Open Parasoft Load Test:
- Windows: Go to Start > Programs > Parasoft > SOAtest > Load Test.
- Linux/Mac: Change directories to the loadtest directory, then enter the following command at the prompt:
./loadtest
- The Welcome Wizard launches. Choose New Project and click Next.
- Choose SOAtest and click Next.
- Do one of the following:
- Browse to the ParaBank Functional Test.tst file in your SOAtest workspace and click Next.
- If you are using the SOAtestTutorial.tst file to complete this tutorial, browse to SOAtestTutorial.tst and click Next. If you created this from scratch, it will be in your workspace. Otherwise, open the sample file at
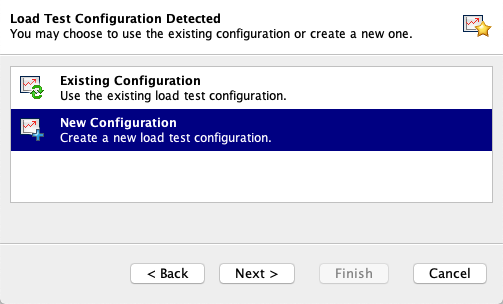
<Parasoft SOAtest/Load Test Install Dir>/examples/tests/. If Load Test detected an existing configuration, choose New Configuration.
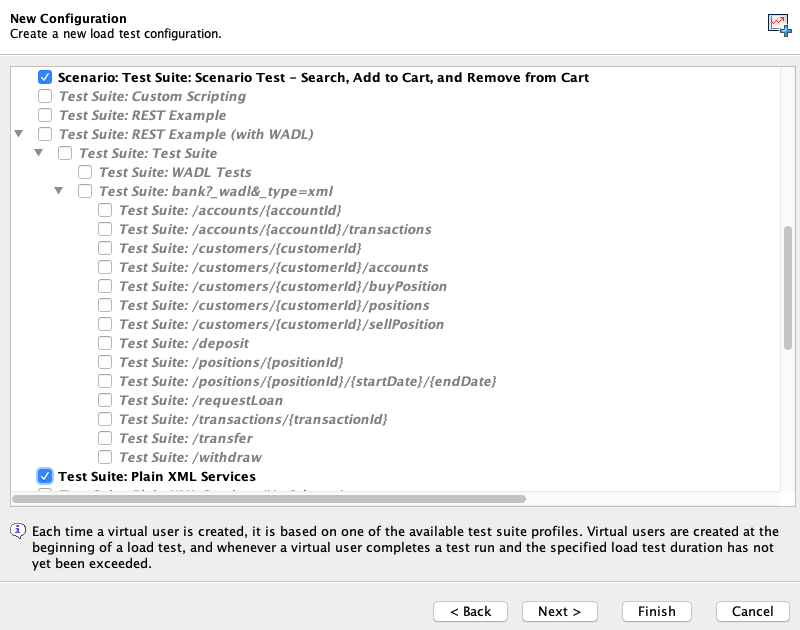
- Choose the test scenario in the tree and click Next:
- Services: Scenario: Test Suite: Scenario Test – Search, Add to Cart, and Remove from Cart, Test Suite: Plain XML Services.
Web: Scenario: ParaBank Functional Test.
- Services: Scenario: Test Suite: Scenario Test – Search, Add to Cart, and Remove from Cart, Test Suite: Plain XML Services.
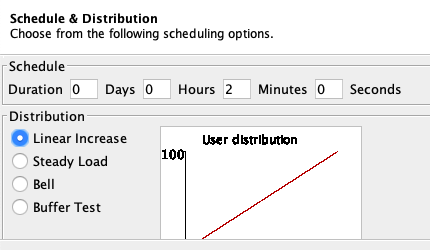
- Specify the following configuration In the Schedule & Distribution screen and click Next until you reach the Other Options screen:
- Enter
2in the Minutes duration field. - Enable the Linear Increase option in the Distribution section. In order to select the Linear Increase option, you must have the appropriate Load Testing license. If you do not have Virtual Users enabled on your license, you will only be able to generate the Steady Load scenario.
- Enter
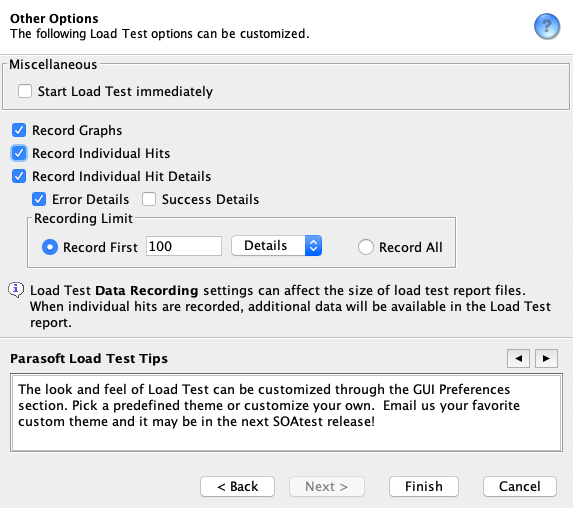
- In the Other Options screen, enable Start Load Test immediately and Record individual hits and click Finish.
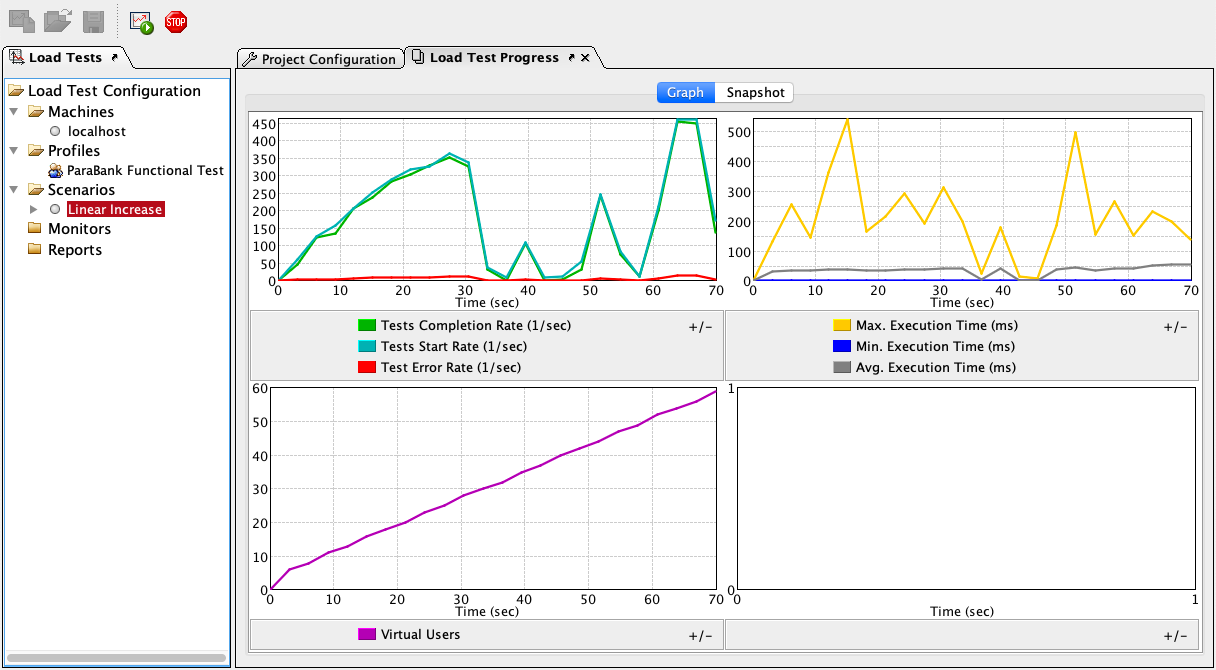
Load Test will begin the specified load test. A new Load Tests tab displays in the left GUI panel and the Graph tab displays in the Load Test progress panel.
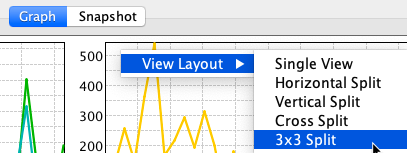
You can change the number and layout of graphs shown by right-clicking in the Graphs tab, then choosing one of the available layout options.
The load test can be stopped at any time, but we will let it run the full two minutes while monitoring and manipulating the in-progress details of the test.
Looking at the Load Test Progress tab, note that the Graph tab shows the following:
- The Virtual Users curve climbs in a steady, linear fashion, in accordance to the Linear Increase scenario chosen previously in this lesson.
- If the Tests Completed and the Tests Started curves closely match each other, this indicates that the tests are being served quickly (for example, the responses are received quickly). If there is a wider gap between these curves, the execution time of the tests is longer.
Also note that the Snapshot tab displays the current active virtual users and the operations they are invoking. During test execution, the information in this tab is updated every three seconds.
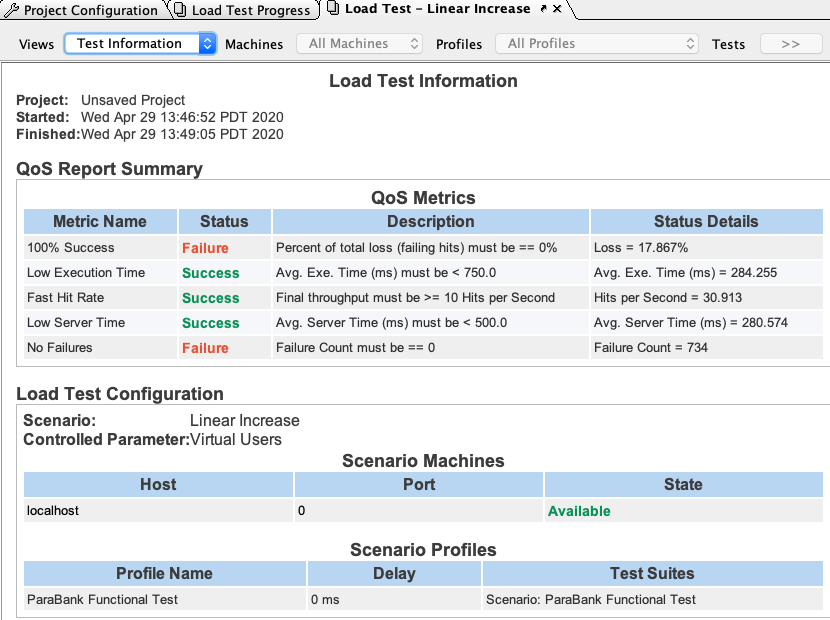
After the load test is complete, a Test Information summary is shown in the Results panel which includes the name of the project, when the load test was started and finished, the scenario you chose, as well as any machines and profiles.
You can also choose to view different statistical reports of the load test as well. To view detailed statistics of the load test, complete the following:
- Choose Statistics from the Views menu in the Results panel.
When viewing the Statistics report, an Output Types menu is available. The Output Types menu determines what type of output report is displayed. Two types of reports are available from this menu, each of which displays different columns of information. The differences between report types are:- Generic Reports: Contains Test Suite name, Test Index, Test Name, Min/Max/Avg Time (ms), Run Count, and Failure Count.
- Network Client Report: Contains all of the information in Generic Reports plus Min/Max/Avg Ping (ms), Min/Max/Avg Request Size (bytes), Min/Max/Avg Response Size (bytes) Min/Max/Avg Total Size (bytes).
- To access details about a specific test failure, double-click the related report row. You can determine whether a given test failed by locating the row that represents that test, then checking the number in that row’s Failure Count column.
Customizing Load Test Profiles and Scenarios
You can customize how a particular load test is run by customizing the profiles and scenarios you plan to use. You can determine the length of time a load test lasts, the distribution of virtual users, the hit rate over time and machines, and the distribution of user profiles over time.
- Double-click the Profiles folder in the Load Tests tab and select one of the available test suite nodes. The configuration panel appears on the right.
- At the bottom of the panel, change the delay Value to
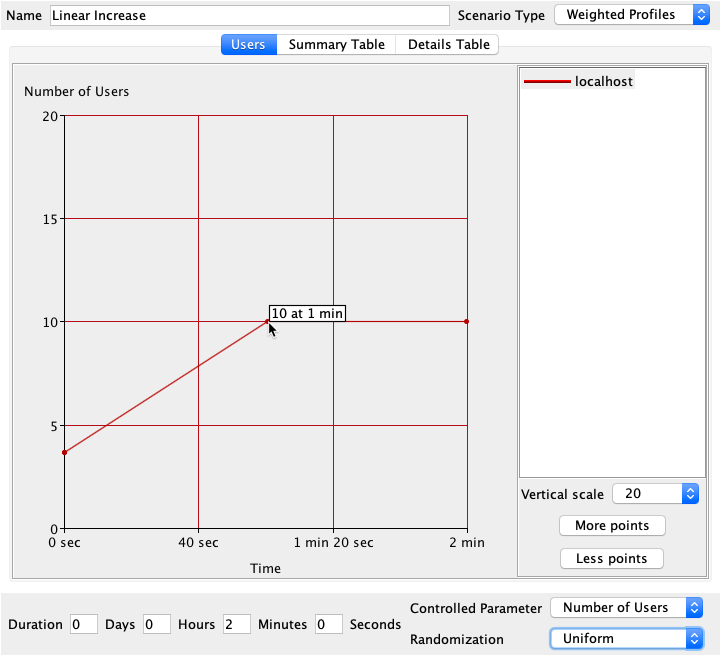
3seconds. This may simulate how a user hesitates before making a decision about ordering a book. - Select Linear Increase beneath the Scenarios node. The Linear Increase scenario controls appear in the Results panel and the User graph shows the localhost curve.
- Drag and drop the endpoint of the localhost curve to the coordinates of 10 users at 2 minutes.
- From the Vertical scale menu, choose 20.
- Click More Points. A point will appear at the center of the localhost line.
- Click and drag the new point to the coordinates of 10 users at 1 minute.
- Expand the Linear Increase node and choose the QoS node beneath it. Summary and Details tabs appear.
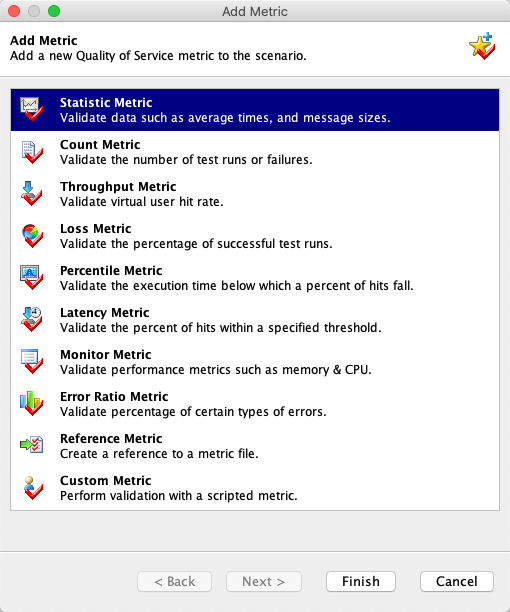
- Click the Details tab and click New to open the Add Metric wizard.
- Choose Statistic Metric and click Finish.
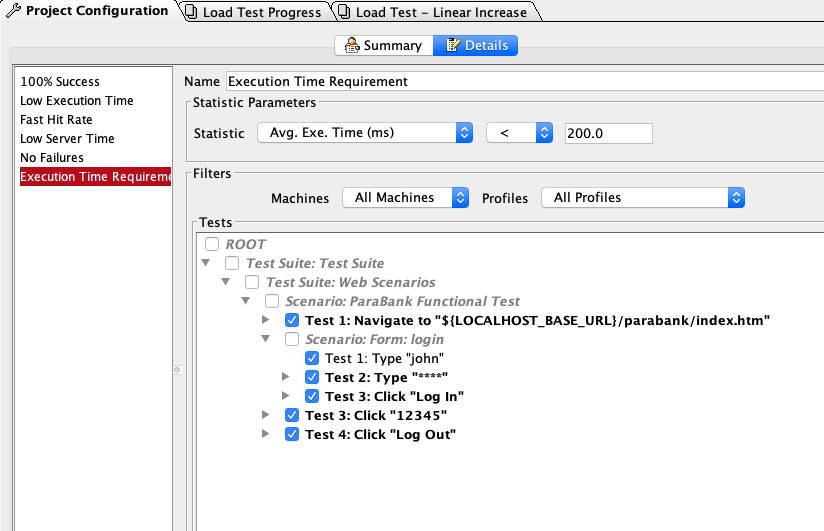
- In the metric configuration panel that opens, enter
Execution Time Requirementin the Name field. - For the Statistic menus in the right GUI, choose Avg. Exe. Time (ms) and the less than symbol (<), and then enter
200in the text field. This will cause the load test result to "fail" if the execution time is measured above 200 milliseconds. For more information on configuring QoS metrics, see Customizing QoS Metrics for Scenarios. - Select the Linear Increase node beneath the Scenarios branch and click Load Test on the tool bar. Load Test will begin the customized load test and the Graph tab appears in the right GUI panel.
- Wait (two minutes) for the load test to complete. While the load test is running, you can view various parameters within the Graph tab by selecting the appropriate checkboxes.
After the load test is complete, a Test Information summary is displayed in the right GUI panel which includes the name of the project, when the load test was started and finished, the scenario you chose, as well as any machines and profiles.
Video Tutorial: Fine-tuning Load Test Configurations and Scenarios
Viewing Reports
Once the load test is completed, collected data must be analyzed in order to see how the application/service performed under load. Load Test gives you the ability to configure and generate load test reports.
In this section, you will learn how to view the Detailed Report and how to generate an HTML Report.
To view detailed reports, complete the following:
- Choose Detailed Report from the Views menu in the Results panel. A Graph tab appears with various parameters.
- Within the graph you can perform the following:
- To view different parameters to graph and view, enable the desired parameter located at the bottom of the Results panel.
- To view multiple parameters in a logarithmic scale, enable Log Scale. A logarithmic scale allows you to see the shape of multiple curves on the same graph (even if the displayed values are very far from one another).
- To view recorded details for entire graph, right-click any area of the graph and choose Show Recorded Details. Error details are recorded by default. You can record success details as well; see Customizing the Data Recording Parameters for details on how to configure this.
As you can see, you can gather various details of a load test from the Graph tab of the Detailed Report. Additional information is available through the Histogram and Table tabs as well. For more information on these tabs and the Load Test Detailed Reports, see Reviewing and Customizing Load Test Results.
Saving the Project as a .lt File
- Save this load test project by clicking Save Project on the tool bar.
- In the dialog box that opens, enter a name for the project in the File name field and click Save. Load Test saves the project and adds a
.ltextension to the file name.

