Load Test provides a number of ways to customize load tests. This topic explains how to customize load tests and the available customization options. In this chapter:
Customizing Test Suite Scenarios
You customize how a particular test is run by customizing the scenario you plan to use. You can use scenarios to customize the following parameters:
- Test duration
- Distribution of virtual users over time and machines
- Distribution of hit rates over time and machines
- Distribution of user profiles over time
To customize an existing scenario or create a new scenario:
- Open or create the scenario you want to customize by performing one of the following steps from the Load Tests tab:
- To open an existing scenario: Click the appropriate node in the Scenarios branch. If profiles are not visible, double-click Scenarios to expand this branch.
- To create a new scenario: Right-click the Scenarios node, then choose New Scenario from the shortcut menu.
- Customize the scenario using the controls in the right GUI panel. The following sections describe the available customization controls.
Scenario Name
Type a new name in the Name field to change the scenario name.
Scenario Type
The scenario type determines several aspects of how the scenario can be configured. You can specify the exact number of virtual users or hits per second for each test suite profile. You can also express the test suite profile distribution as a general ratio and let Load Test randomly assign test suite profiles according to the specified ratio.
Choose one of the following from the Scenario Type drop-down menu:
- Weighted Profiles. This type enable you to specify the test suite profile distribution as a weight ratio. The virtual users are distributed among profiles in a randomized weighted manner that allows an arbitrary total load graph and "statistical" following of the profile distribution.
- Direct Profiles. This type enables you to directly specify the exact load (in virtual users or hits per second) for each test suite profile. You can specify the load for all of the machines, or for each individual machine. The total number of VU/HPS cannot be specified directly, but comes as a sum of all profiles for a machine.
Test Duration
Type new values in the Duration fields. The following duration limits apply:
- Days: 30
- Hours: 23
- Minutes: 59
- Seconds: 59
Controlled Parameter
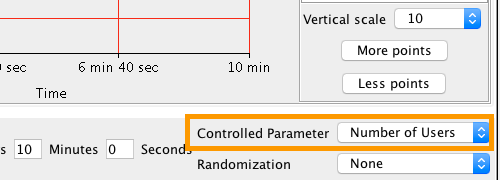
The Controlled Parameter settings determine whether the test is controlled for number of virtual users or the number of hits per second (hit rate).
Choose one of the following options from the Controlled Parameter drop-down menu:
- Number of Users. Load Test will attempt to achieve the specified virtual user quantities and attempt to vary the number of hits per second in the process.
- Hits per Second, Hits per Minute, Hits per Hour, or Hits per Day. Load Test will attempt to achieve the specified hit rates by varying the number of virtual users as needed.
Randomization
Randomization settings determine the randomization of the Controlled Parameters.
If the Controlled Parameter is set to Number of Users, Load Test can randomize the virtual user think time according to the following distributions:
- Uniform: If the virtual user think time defined in the profile configuration is Tprof., then the actual virtual user think time will be a random value uniformly distributed in the interval from 0 to 2*Tprof. with the mean value of Tprof.
- Poisson: If the virtual user think time defined in the profile configuration is Tprof., then the actual virtual user think time will be a random value with the bell shaped distribution and the mean value of Tprof.
- None: No randomization is applied.
If the Controlled Parameter is set to Hits per Second, Load Test can randomize the inter-invocation time according to the following distributions:
- Uniform: If the hit per second rate defined in the load test scenario is Nhps., then Load Test will generate a request sequence with a random inter-invocation time (the time between subsequent requests) uniformly distributed in the interval between 0 and 2* 1/Nhps. seconds and the mean value of 1/Nhps seconds.
- Poisson: If the hit per second rate defined in the load test scenario is Nhps, then Load Test will generate a request sequence with a random inter-invocation time (the time between subsequent requests) with the bell shaped distribution and the mean value of 1/Nhps seconds.
Vertical Scale
Choose a value from the Vertical scale drop-down menu to sets the maximum number of users or hits to be simulated during the test run. The maximum value you can set in a scenario is determined by your license. To see license details, choose Help> About.
If the Controlled Parameter is set to Number of Users, the load applied is the sum of users and hits on all machines in the selected scenario.
If the Controlled Parameter is set to a number of hits configuration, the load applied is determined by the number of hits per second you implement for a given test, as well as the number of machines running the tests. Profile delay options will be unavailable and any preexisting delay settings will be ignored. To determine the number of hits per second you are licensed to execute, divide the number of virtual users for which you are licensed by 10. For example, if you are licensed to use 100 virtual users, you will be able to execute tests at 10 hits per second.
- Right-click on a line in the top right side of the panel and choose a scaling option. You can set the scale for each profile when the Scenario Type is set to Direct Profiles. If you are setting the scale in Weighted Profiles mode, the scale is set per machine.
- Specify a scaling factor when prompted.
Modifying the Graph
The graph is a visual representation of how Load Test is configured to apply the number of users or hit rate over time. Interfaces for configuring the graph differ depending on whether you are configuring profiles directly or configuring weighted profiles.
Specifying Machines
Enable the Machine Independent option to apply the same settings to all test machines (default). This option is available only if there is more than one machine is available. The graph will show one line labeled All Machines. This option enables you to modify the position and shape of the line for all machines simultaneously. Disable the option to apply different settings to different test machines. You can also enable machines individually.
Displaying Profiles
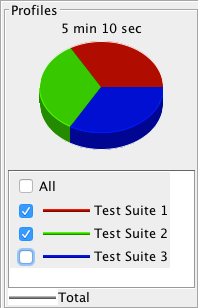
If you are configuring profiles directly (Scenario Type is set to Direct Profiles) and more than one test suite profiles are available, you can display enable the All option to show all profiles or enable individual profiles.
Changing the Vertical Scale
See Vertical Scale for details on changing the graph scale.
Changing the Shape
You can modify points on the graph to change its shape.
- Right-click on a line in the top right side of the panel and choose Edit graph.
- Specify a value in the Y field when prompted.
- Click Next to edit the next point on the graph or Previous to edit the previous point. You can also press Alt-Left Arrow and Alt-Right Arrow to use keyboard shortcuts.
- Specify values for the X field and click Apply.
- Repeat steps 2 and 3 to configure additional points as necessary and click OK when finished.
You can also click and drag points in the graph.
To maintain a steady amount of virtual users or hit rate, ensure that the line is flat, then drag the line up or down until it corresponds to the number of users or hits per second you want for the entire test duration.
You can also right-click on the line in the graph and choose Add point to create additional nodes.
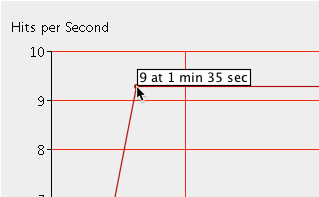
You can click and drag points or right-click and choose Edit point to specify a precise number of virtual users or hits per second. Load Test will automatically determine the number of virtual users or hits per second for each time interval that does not have a specific point by plotting the slope between each of the points.
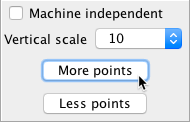
You can also click More points to automatically double the number of points you have created.
The new points will be added at regular intervals between your existing points. To remove one point, right-click a particular point and choose Remove point. Click Less points to remove points that are not points of inflection.
Using a Preset Shape
You can also set the graph to a preset shape.
- Right-click a line’s representation in the top right side of the panel and choose Set Graph Shape.
- Choose a graph shape and set the peak value.
- Click OK to apply the shape to the selected graph.
Setting Profile Weights
You can specify the chances that Load Test will select a particular profile at any point in the test duration. The higher the ratio assigned to a profile, the more likely it is to be chosen. Weighting profiles only applies if multiple test suite profiles are available.
- Choose a value from the Vertical scale to change the maximum ratio of profiles. The higher the value, the more different ratio intervals you will be able to use when determining how Load Test distributes user profiles over time. The ratio of user profiles determines how likely Load Test is to select a particular profile at any point in the test duration.
- Right-click a line’s representation in the top right side of the panel and choose Scale Graph from the shortcut menu to scale a line’s shape for a different range of profile ratios.
- Enter a scaling factor when prompted.
- If you want to to maintain a steady ratio of user profiles, ensure that the line is flat and drag the horizontal bar for each profile up or down until it corresponds to the profile weight you want for all time intervals.
- To vary the ratio of user profiles, create a "point" for each time interval for which you want to specify the profile weight (see Changing the Shape) then drag that point to the desired location. Load Test will automatically determine the profile weights for each time interval that does not have a specific point; it does this by plotting the slope between each of the points.
- You can automatically double the number of points you have created by clicking More points. The new points will be added at regular intervals between your existing points. You can remove a point by right-clicking it and choosing Remove point. To remove points that are not points of inflection, click the Less points button.
Tip
Customizing QoS Metrics for Scenarios
The Load Test Quality of Service (QoS) analysis feature allows users to estimate the performance of a service/application by applying QoS metrics to Load Test results. Based on these metrics, Load Test can evaluate performance to determine the success or failure of the load test. QoS analysis is particularly important when a service/application is required to meet specific performance requirements before it can be considered ready for deployment.
Introducing QoS Metrics
QoS Metrics allow you to define a set of regression tests for a load test. On a succeeding load test, all metrics will pass successfully. Any metrics that fail are indications of a regression in the performance of their service/application.
QoS functionality can be accessed from the load test tree. Under each of the Scenario nodes (Bell, Buffer Test, Linear Increase, Steady Load) is a corresponding QoS node. After selecting a QoS node, the Summary and Details tabs display in the right GUI panel.
The Summary tab displays a global view of QoS metrics that have been configured within the Details tab. The Summary tab contains a list of metrics and their descriptions. There are five default metrics in the Summary tab Metric list:
- Low Execution Time: Verifies that the average execution time is below the specified threshold.
- Low Server Time: Verifies that the average server time is below the specified threshold.
- No Failures: The total number of failures occurring during the load test must be zero.
- Fast Hit Rate: The throughput achieved during the load test must be above the defined level.
- 100% Success: The measured percent of succeeding request messages must be exactly 100%.
Each of the above metrics are grouped according to its type (e.g. Statistic, Count, Throughput, Loss). Any additional metrics you configure will also display in the Summary tab.
The Description list contains automatically generated descriptions of what each metric is verifying based on the parameters that have been specified for that metric.
The Details tab displays the available metrics that have been configured for the selected scenario. The Details tab also displays the name, parameters, and notes for the metric selected from the Metric List.
Creating a New QoS Metric
To create a new QoS metric, complete the following:
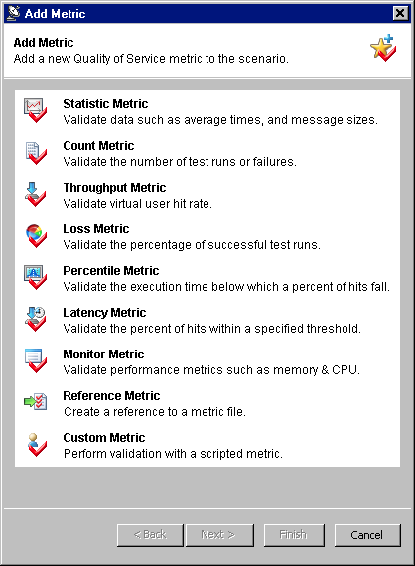
- Click the New button beneath the Metric List. The Add Metric wizard displays.
Select the desired QoS metric from the Add Metric wizard and click Finish.
The QoS metric is added to the left panel while its parameters display in the right panel of the Details tab.
Each metric performs a different set of validation on completed load test results. After a load test is run, a QoS Report Summary will display in the Test Information report, while a separate and more detailed QoS Report will also be available.
The Effect of Filter Selections on QoS Metric calculation
The selections you make in the Test Tree Selection panel (described in Test Tree Selection Panel Navigation and Options) within QoS Metric Machines, Profiles and Tests filter panels affect the data sets that are used for calculation of the metric value. This will subsequently affect the success or failure outcome of the metric. You can preview the data used in calculation of the metric types listed below in the relevant sections of the load test report.
- Statistic Metric – See the Statistics section of the report. Note that the Avg. (average) parameters of the Statistic Metric are calculated based on the number of runs of each test selected for that metric. You can see these numbers in the Run Count column of the load test report’s Statistics section.
- Count Metric, Loss Metric – See the Statistics section of the report.
- Throughput – See the Graph tab of the Detailed Report section.
- Percentile Metric, Latency Metric – Select Show Individual Hits in the Graph tab of the Detailed Report view.
- Error Ratio Metric – Select Show Recorded Details in the Graph tab of the Detailed Report view. See the Details column of the Table view that comes forward after selection.
Also, see the tool tip displayed in the Parameters panel of a QoS Metric view for further metric explanation based on current metric values.
Configuring QoS Metric Parameters
To make changes to any of the QoS metrics, select a metric from the list in the left pane of the Details tab and configure its parameters accordingly in the right pane of the Details tab. Depending on the metric selected, the options will vary. However, if you hold your cursor above the parameters in the right pane, a tool tip will display information about the parameter configuration.
You can also select one or multiple (CTRL-click) metrics from the list, then right-click your selection(s) and Cut, Copy, Paste, or Delete as needed from the shortcut menu. When right-clicking one or multiple (CTRL-click) metrics from the list, you can select Save Metrics As to save the selected metrics as a QoS metric set (.ms file), and you can also select Load Metrics to load previously saved metric sets. You can also change the order of the list by dragging and dropping the desired metrics into the desired order.
Customizing Scenarios that Contain a Large Number of Profiles
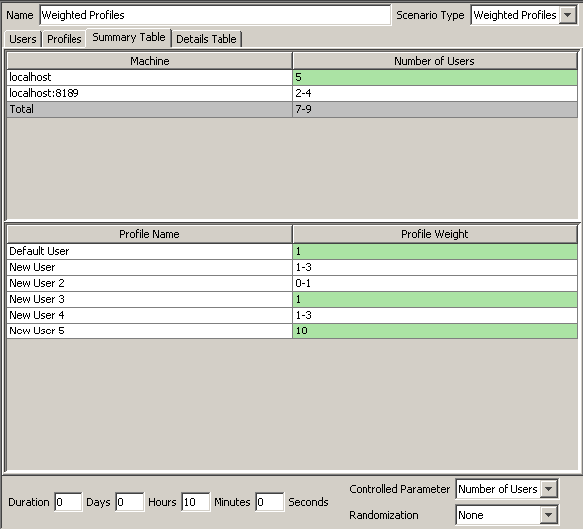
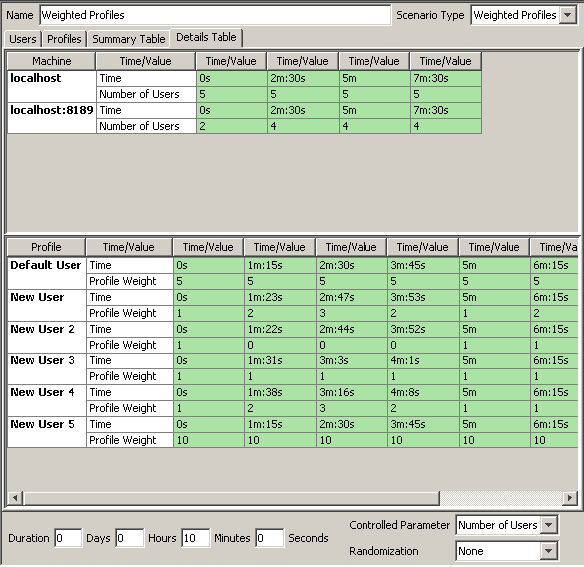
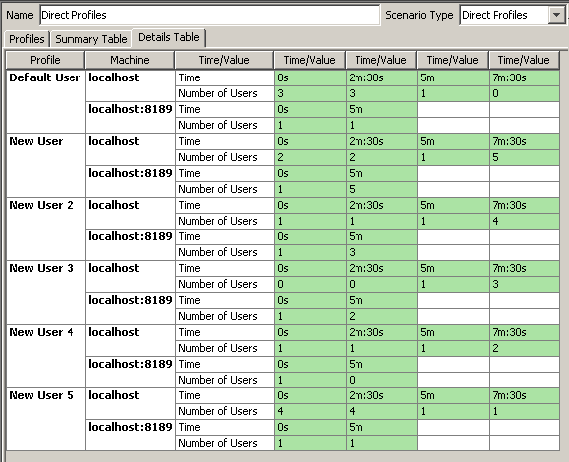
For scenarios that contain a large number of profiles, and/or a large number of graph points, it may become difficult to configure and keep track of the various options in each graph of the User and Profiles tab. In such cases, it may be easier to use the Summary Table and Details Table available for each scenario.
To view the Summary Table and Details Table, select the desired Scenario node and the Summary Table and Details Table tabs display in the right GUI panel.
Within the Summary Table and Details table views, you can edit the green fields such as the Number of Users for each machine and the Profile Weight of each profile. Changes you make in these green fields will reflect in the corresponding Users and Profiles tabs and vice versa. For example, if you change the Profile Weight of the Default User from 1 to 5, that change will reflect in the Profiles tab. Similarly, the same change in the Profiles tab will reflect in the Summary Table tab or Details Table tab.
Summary Table
The Summary Table view provides different information depending on whether Weighted Profiles or Direct Profiles are selected as the Scenario Type.
- The Summary Table view for Weighted Profiles provides two separate tables: one for machines and one for profiles.
- The Summary Table view for Direct Profiles provides one table in which you can change the Number of Users for each machine:
Detail Table
The Detail Table view provides different information depending on whether Weighted Profiles or Direct Profiles are selected as the Scenario Type.
- The Detail Table view for Weighted Profiles provides two separate tables: one for machines and one for profiles.
- The Detail Table view for Direct Profiles provides one table in which you can change the Time/Value for each user profile:
Configuring Environments
An environment is a collection of variables that can be referenced in your Load Test configuration. When running a test, Load Test will substitute the names of variables in your project configurations with the values of those variables in the active environment. By changing which Environment is active, you can quickly and easily change which values Load Test uses.
Creating and switching environments is done through the Environments tab. To access this tab:
- Select the Profiles node in the Load Test Configuration tree.
- Open the Environments tab.
The Environments tab is divided into two sections, the Environments List panel (left) and the Environment Details panel (right).
Configuring the Environments List
The environments list panel contains the following buttons to manage environments:
Add: Click to add a new environment to your project.The Add button can also be dropped down by clicking the down arrow on the right of the button. The following options are available.
- Import...: Click to load existing environments from a
*.envfile into your project. Subsequent changes to the*.envfile will not be reflected in your project. - Reference...: Click to reference existing environments from a
*.envin your project. Subsequent changes to the*.envfile will be reflected in your project.
- Import...: Click to load existing environments from a
- Remove: Click to remove the selected environment(s) from your project.
- Set: Click to make the selected environment the active environment.
Configuring the Environment Details Panel
After creating and/or selecting an environment, the Environment Details panel will display a table and buttons for managing environment variables.
- Add: Click to add a new environment variable.
- Remove: Click to remove the selected environment variable.
To edit an existing environment variable, either double-click on a value or simply click to highlight the value and type to overwrite it.
Configuring Asynchronous Tests
If the SOAtest project that you are using for load testing contains tests with Call Back tools and Asynchronous testing features—or Message Stub tools—you will need to start the SOAtest server inside Load Test in order to process the SOAtest project related asynchronous messaging.
You can start the SOAtest Server in two ways:
- Manually: Select View> Show Server in the toolbar. The Server tab will appear in the left panel of the Load Test GUI. Then, right-click the Server node and choose Start Server.
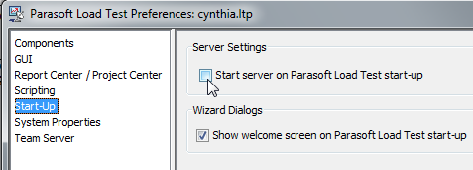
- Automatically: In the Load Test preferences, select the Start-Up section and enable the Start server on Parasoft Load Test start-up option. After you save your preferences, you will need to restart Load Test before this setting takes effect.
If you are running a load test with SOAtest asynchronous tools in command line mode or in Load Test server mode, you will need to enable the automatic SOAtest Server startup on each of these machines (because in command line mode, the SOAtest Server can only be started automatically).
Configuring Data Source Usage
If your SOAtest .tst file references data sources, you can configure how those data sources are used during load testing.
To configure data source options:
- Select the Profiles node in the Load Test Configuration tree.
- Open the Data Source Options tab. The available data sources will be listed in the left panel.
- To configure data source options that apply across the test suite, select the test suite you want to configure, then customize the following options as needed in the right panel:
- Stop load test after all rows have been used: If data source rows become invalid after they are used, enable this option, then specify when you want the load test to stop—either when the first machine runs out of rows or when all machines run out of rows. This helps you to manage the duration of your load test.
- Report recommended partition sizes: Determines if Parasoft Load Test generates a report (based on the results of the load test) that includes recommended partition sizes for each data source on each machine.
- To configure options for a specific data source, select the data source whose options you want to configure, then customize the following options as needed in the right panel:
- Use each row only once (i.e., data becomes invalid after use): Determines whether the values in a data source row can be used more than once during a test. If this option is enabled, SOAtest will sequentially iterate through the data source values; random iteration through the data source values is not allowed. This option is particularly useful for Web applications where certain kinds of data can only be entered into the application once (for example, social security numbers, unique id numbers, and so on).
- Different users can use the same row concurrently: Determines if the values in this data source can be used by only one virtual user at a time. Disabling this option is particularly useful if you want SOAtest to assign login username/password pairs from this data source, but your site prohibits multiple simultaneous logins from each user. If this option is disabled, SOAtest will report a message if the number of virtual users attempting to use the data source during a test exceeds the number of available rows. If this occurs, you should ensure that the number of rows in the data source exceeds the number of virtual users that will be using the data source, then rerun the test. This option is only available if the Use each row only once (i.e., data becomes invalid after use) option is not selected.
- Virtual users iterate through data: Determines whether SOAtest iterates through the data randomly or sequentially. This option is only available if the Use each row only once (i.e., data becomes invalid after use) option is not selected.
- In sequential mode, SOAtest repeatedly iterates through the data throughout the test. It uses all data source values, starting with the values in the first data source row, and moving sequentially through the data source rows up until the last data source row. Once SOAtest uses the values in the last data source row, it starts over again with the values from the first row.
- In random mode, SOAtest randomly selects a data source row each time it needs a data source.
- In sequential mode, SOAtest repeatedly iterates through the data throughout the test. It uses all data source values, starting with the values in the first data source row, and moving sequentially through the data source rows up until the last data source row. Once SOAtest uses the values in the last data source row, it starts over again with the values from the first row.
- Virtual users iterate through all rows for each test: Determines if virtual users can iterate through all rows of this data source before running the next test. If this option is not selected, virtual users execute a single row at a time, then runs the next test and so on. This option is only available if the Use each row only once (i.e., data becomes invalid after use) option is not selected.
- Partitions: Allows you to customize how the data source is partitioned for distribution to load test server machines.
- Data sources will be partitioned when either the Use each row only once option is enabled or the Different virtual users can use the same row concurrently option is disabled.
- To customize how the data source is partitioned for distribution to load test server machines, enable Use custom data source partitions, then enter specify the desired distribution in the table.
- To specify that a given machine should receive no data source rows, enter 0 for both the First row and Last row cells. All data source rows must be distributed to one load test server machine.
Configuring Setup/Teardown Test Execution
If your SOAtest .tst file uses setup or teardown tests, you can configure how those tests are used during load testing.
To configure setup/teardown options:
- Select the Profiles node in the Load Test Configuration tree.
- Open the Setup/Teardown Options tab.
- Choose the desired option. Available options are:
- Run once per virtual user: Setup and teardown tests will be run once for each virtual user.
- Run once per machine: Each machine will run setup and teardown tests once per load test.
- Run once per load test: Setup and teardown tests will be run once per load test.
Customizing Profiles
Each time a virtual user is created, it is based on one of the available profiles. Virtual users are created at the beginning of a load test, and whenever a virtual user completes a test run and the specified load test duration has not yet been exceeded.
You can configure any number of profiles or machines, but the number of virtual users or number of hits per second you use is limited by your license. For example, if you are only licensed to run 100 virtual users, you can configure any number of profiles, but only 100 virtual users based on those profiles can be active at any given time. If you have 20 profiles, but are only licensed to run one virtual user, all 20 profiles will eventually be used during the test (provided that the test has a sufficient duration), but only one profile will be active at any given time.
To customize the default profile or create a new profile:
- Open, disable, enable, or create the profile you want to customize by performing one of the fol-lowing steps:
- To open an existing profile: Click the appropriate node in the Profiles branch. If profiles are not visible, double-click Profiles to expand this branch.
- To disable/enable an existing profile: Right-click the appropriate node in the Profiles branch and select Disable/Enable from the shortcut menu. If disabling a profile, the profile will not run with the load test until it is enabled again.
- To create a new profile: Right-click the Test Suite Profiles node, then choose New Profile from the shortcut menu.
- Customize profile options using the controls in the right GUI panel. Available options include:
- Name: Determines the profile name.
- Profile Runnables: Determines what tests or custom operations are executed. Check the check boxes that represent the tests you want to use. You must select at least one test. If you want child tests to assume the parent test’s setting (enabled or disabled), check the Propagate Selection option. If you add multiple test suites, they will be executed in the order in which they are listed in this panel.
- Delay: Indicates the length and type of delay you would like to simulate between this profile’s test iterations. If this profile is used in a scenario that controls the test for number hits per second (rather than for number of virtual users), all delay options will be ignored. Delay options include:
- End-to-Begin: Prompts Load Test to measure the delay from the end of the previous virtual user invocation to the beginning of the subsequent virtual user invocation.
- Begin-to-Begin: Prompts Load Test to measure the delay from the beginning of the previous virtual user invocation to the beginning of the subsequent virtual user invocation.
- Minutes: Determines the delay in minutes. Enter the number of minutes in the text field or move the slider accordingly.
- Seconds: Determines the delay in seconds. Enter the number of minutes in the text field or move the slider accordingly.
- Milliseconds: Determines the delay in milliseconds. Enter the number of minutes in the text field or move the slider accordingly.
Tip
If you want different tests to use different delays, you can configure the delays at the test level in SOAtest (in the Execution Options> Test Flow Logic tab within the test suite’s configuration panel). Any delays configured at the test level will override delays specified in the Load Test profile. The Load Test Begin-to-Begin/End-to-Begin selection will not be applied for tests with individual delays.
Limiting Hits per Second in the Virtual User Mode
It is sometimes desirable to limit the Hit per Second rate in a load test scenario that has Virtual Users selected as a controlled parameter. There are two ways to limit the hit per second rate in the Virtual User mode:
- Set the appropriate delays in the Virtual User profile configuration: This is the preferred method. The hit per second rate is inversely proportionate to the time between Virtual User test invocations. This time consists of the test execution time and the Virtual User Delay time. For instance setting a Virtual User profile Begin-to-Begin delay to 1 second will cause the hit per second rate of a 4 virtual user load test scenario to stay at or under 4 hits per second. For more information on the Virtual User profile delays see the Customizing Profiles section of the documentation.
- Configure Hit per Second throttling in the Scenario Summary Table view: In the Weighted Profiles mode of a Load Test scenario that has Virtual Users selected as a controlled parameter, you can directly set the Hit per Second limit for each machine in the load test configuration. The Summary Table of the load test Scenario view (see the screenshot below) includes a table that allows you to enable Hit per Second throttling for any machine in the load test configuration and set the Hit per Second limit for that machine. When using this mode, be aware that the HPS throttling controller of the load test has a priority over the part of the application that enforces the Virtual User delays. As a result, the Virtual User profile delay times may likely will be ignored in order to throttle the Hit per Second rate.
The following image shows an example of configuring Hit per Second throttling in the Scenario Summary Table view:
Customizing the Data Recording Parameters
The Report Settings tab of the Scenarios control panel lets you configure what data is recorded during the load test.
Available options are:
- Record Graphs: Record the load test graph data that are available in the Detailed Report section of the load test report.
- Record Individual Hits: Record all individual hits that are available as a "scatter" view in the Detailed Report section of the load test report.
- Record Individual Hit Details: Record Error and/or Success details of individual hit execution. Error and Success details depend on the Load Test component type. For SOAtest components, the following is recorded as Error/Success details:
- Error Details: Contains an error description string for all tests and test traffic for the following SOAtest tool tests: SOAP Client, Browser Test, REST Client, Messaging Client.
- Success Details: Contains traffic for the following SOAtest tool tools: SOAP Client, Browser Test, REST Client, Messaging Client.
- Recording limit: Limits the amount of Error and/or Success data recorded in the load test report. The limit can be set to either the maximum number of the collected test execution details or to the size of details data.
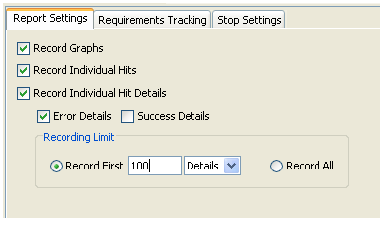
To limit the report size by setting the maximum number of recorded details, select the Details option in the Recording Limit panel:
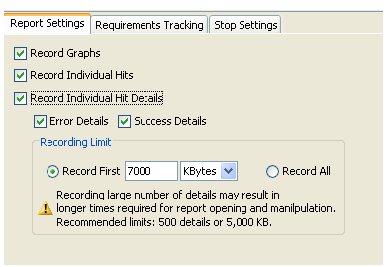
To limit the report size by the maximum allowed recorded data size, select the KBytes(kilobytes) option in the Recording Limit panel.
Note that the Record Individual Hit Details option can be used when the Record Individual Hits option is unchecked. In this case, the individual hit data (the scatter view section of the report) will not be recorded, but the test execution details will still be available via the Show Recorded Details right-click menu option of the load test report graph view.
For information on viewing the Success and Error details in the load test report, see Detailed Reports.
Customizing the Load Test Stop Procedure
Customizing Load Test Stop Sequence
The Stop Settings> Stop Sequence area of the Scenarios control panel lets you configure how Load Test behaves after a load test Stop event has been generated and the actual stop of the load testing activities. (We will use the term "Load Test Stop time" to refer to the time between the moment a load test Stop event is generated and the actual stop of all load testing activities.)
A load test Stop event is generated if:
- A Load Test user manually stops the load test by clicking the Stop toolbar button.
- The load test duration reaches its scheduled time length.
- The load test Stop Action "fires" (see the Customizing Load Test Stop Actions section below).
After a Load Test Stop event is generated, Load Test stops creating Virtual Users and waits for the existing Virtual Users to exit. The Quick Stop and Formal Stop options control whether the Virtual Users exit after the completion of the current test or complete all their scheduled tests:
- Quick Stop (default option) - If selected, each Virtual User exits after the completion of its current test. Selecting this option will cause load test to stop quickly; however, the Virtual Users that were active when the Stop command was issued might not complete all the tests or data source iterations scheduled for the Profile to which they belong.
- Formal Stop - If selected, Virtual Users execute all their tests and data source iterations as scheduled in the Virtual User profile configuration. Choosing this option might cause the Load Test Stop time to increase (compared to the Quick Stop sequence). If the Virtual User test list or data source iteration list is long, the increase might be significant.
Tip
If the stop procedure is taking too long, use the Force Stop button in the Load Test stop progress dialog (See Tip: Stopping a Test for more details).
Customizing Load Test Stop Actions
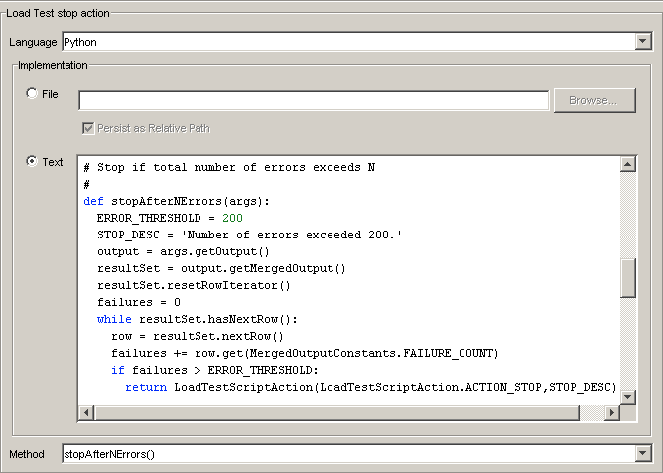
You can customize how a load test is stopped by utilizing Java, JavaScript, or Jython scripts. This feature is especially useful in automatically stopping load tests for specific circumstances that may cause undesirable results. For example, during nightly load test runs you may want to stop load testing if a certain amount of errors have been reached, or you may want to stop load testing if your CPU utilization reaches a specific threshold.
The script you define communicates with the Load Tester via the com.parasoft.api.loadtester API and receives LoadTestScriptArgs and Context as arguments, and can also return a LoadTestScriptAction. A returned LoadTestScriptAction.Action_Stop has the same effect as pressing the Stop button in the Load Test GUI during a load test.
[Load_Test/SOAtest_installation_dir]\[version number]\examples\loadtest\LoadTesterScripting.To use scripts to customize Load Test stop actions:
- Select the Scenarios node in the Load Tests tab and choose the StopSettings tab in the configuration panel on the right.
- Select Java, JavaScript, or Jython from the Language drop-down list to indicate the language that your script is or will be written in.
- Define the script to be implemented in the Implementation box.
- For Java methods, specify the appropriate class in the Class field. Note that the class you choose must be on your classpath.
- For JavaScript and Jython scripts, you can use an existing file as the source of code for your method or you can create the method within Load Test.
- To use an existing file, select the File radio button and click Browse. Select the file from the file chooser that opens, then click OK to complete the selection.
- To create the method from scratch from within Load Test, select the Text radio button and type or cut and paste your code in the associated text window.
- To check that the specified script is legal and runnable, right-click the File or Text field (click whichever one you used to specify your script), then choose Evaluate from the shortcut menu. Load Test will report any problems found.
- Select the appropriate argument from the Method drop-down list. This list will be composed of any definitions contained in your script. Since a script can contain multiple arguments you can select the one that you want to use in this method.
- Run the load test.
The script you define is called every three seconds (the frequency of load test output collection) during load testing.The load test will stop if any of the criteria you specify in your script is met. The user-defined description of the load test stop action will be reflected in the Load Test report if the script causes the load test to stop. Any script errors are reported in the Log tab of the Load Test Progress view.
Customizing Machine Options
Using High Throughput Mode
High Throughput Mode can be used to apply higher levels of load to the system under test—while minimizing the hardware required to generate such load.
Each Load Test machine participating in a load test can be configured to run in a High Throughput Mode. In this mode, the test response verification and non-critical attached tools are disabled. As a result, fewer system resources, such as CPU cycles, are required to run the load test. This allows machines in High Throughput Mode to run at a higher test per second execution rate.
To enable this mode, select the appropriate machine from the Machines node in the Load Test Configuration tree, then enable the High Throughput Mode option.
Typically, users select some of the machines to run in a regular Verified and some in an Unverified – High Throughput mode. The machines that run in the Verified mode act as both load generators and Test result collectors, while the machines in the Unverified mode act only as load generators. Upon the completion of a load test, the results which were collected in the Verified mode are used to estimate the error count intervals for the machines in the Unverified mode and Total error count estimate intervals for the entire load test.
Below are several typical questions and answers that could help better understand how to apply the High Throughput Mode feature:
When should I use the High Throughput Mode?
You should use the High Throughput Mode if you do not have enough hardware to generate the desired load. For instance if your load generating machines are running at or above 75-80% CPU utilization.
What kind of throughput increase can I expect?
The throughput increase will vary depending on the structure of your functional tests. The more tools you have attached to the tests in the functional test configuration, the greater the performance gain in the High Throughput Mode.
How are the error estimates calculated?
The calculation of the error estimates is based on the calculation of the "Binomial proportion confidence interval" using Wilson’s method. More on this subject can be found via the following links:
- National Institute of Standards and Technology: http://www.itl.nist.gov/div898/handbook/prc/section2/prc241.htm
- Wikipedia: http://en.wikipedia.org/wiki/Binomial_proportion_confidence_interval
What should be the proportion of tests that are run in the Verified and Unverified modes?
In general, the more tests you run in the Verified mode, the more narrow error estimate intervals you will get. As a rule of thumb, the number of runs for each Test in the Verified mode should be at least in the mid tens, such as 40-60.
Generating Network Traffic from Multiple IP Addresses
Parasoft Load Test can be configured to use multiple IP addresses for its Virtual Users. Configuring this ip spoofing involve two steps:
- Setting up IP aliases on the load test machine(s) as described in the appropriate section below:
- Configuring Virtual Users to use multiple IP addresses as described in Configuring Load Test Machines to use Multiple IP Addresses
Supported Parasoft SOAtest Components
The following SOAtest tools and transports support the multiple IP address functionality:
- SOAP Client - HTTP & HTTPS
- Messaging Client - HTTP & HTTPS
- REST Client - HTTP & HTTPS
- Browser Tool - HTTP & HTTPS
- FTP Client - FTP only, not FTPS
- Transmit Tool
Windows Configuration
To set up IP aliases on a Windows machine:
- Use the
ipconfigcommand to see the list of available network interfaces, their IP addresses, and masks. - Use the
netshcommand in a DOS prompt window (DOS shell) or in a batch script to add or remove IP addresses.To add an IP address, run a
netshcommand similar to the one in the following exam-ple (substituting your own network interface name, IP address and mask).netsh -c Interface ip add address name="Local Area Connection" addr=10.10.29.9 mask=255.0.0.0
To remove an IP address, run a
netshcommand similar to the one in the following example (substituting your own network interface name, IP address and mask).netsh -c Interface ip delete address name="Local Area Connection" addr=10.10.29.9
Linux Configuration
To set up IP aliases on a Linux machine:
- Use the
ipcommand to add or remove IP aliases to a network interface.
The example below adds an IP alias to eth0 interface:
# ip address add 10.10.29.9 dev eth0
The example below removes an IP alias.
# ip address del 10.10.29.9 dev eth0
Configuring Load Test Machines to use Multiple IP Addresses
To configuring Virtual Users to use multiple IP addresses:
- Select the appropriate machine from the Machines node in the Load Test Configuration tree.
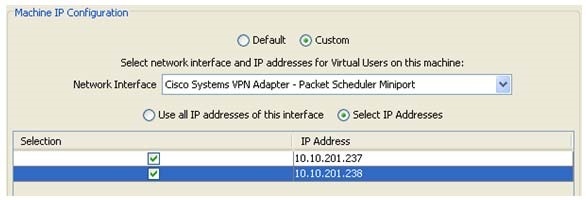
- In the Machine IP Configuration panel of the machine configuration view, select Custom and choose the network interface that you would like to use. You can either choose to use all IPs of the selected interface or select specific IP addresses.
The machine network interface and IP configuration view is shown below:
During the load test execution, each Virtual User on a machine will be assigned an IP address from the list of IP addresses for this machine.
Virtual Users (VUs) will be assigned IP addresses in a round-robin manner. For instance, if the machine "localhost" was configured to use two IP addresses as shown in the image above, then the VUs would be assigned IP addresses in the following order:
- VU 1 – 10.10.201.237
- VU 2 – 10.10.201.238
- VU 3 – 10.10.201.237
- VU 4 – 10.10.201.238
Once an IP address is assigned to a Virtual User, it will be used in all the tests which that Virtual User has to execute.
Synchronizing Remote Machines
A SOAtest project that you use in Load Test can have external dependencies in the form of files that are used by the SOAtest tests while they are being executed by the Virtual Users of the load test. The correct functioning of the SOAtest project tests depends on the availability of these external resources on both the Load Test controller machine and remote machines running load generators. Load Test automates the process of transferring the external dependencies to remote machines.
For details on how to ensure that all external resources required by the project are available on the remote machine, see Transferring Project External Dependencies to Remote Machines.

