...
Once functional tests have been created in SOAtest, the next step is load testing with Parasoft Load Test. Load testing allows you to emulate conditions of heavy usage, which can expose bugs that may only surface under these conditions. You can load test Web, SOA, and combined end-to-end tests (test scenarios that extend beyond the message layer through Web services, JMS, web interface, database, etc.).
| Scroll pdf ignore |
|---|
In addition, Parasoft Load Test includes a framework for load testing any component that implements the Parasoft load test component API; for example, it can allow performance and concurrency testing of JUnits or load testing with lightweight Socket-based components that implement the Parasoft component API. This allows the load test to be specialized and tailored for the various unique complexities that organizations face in performing performance validation.
...
- Enslaving Multiple Machines (Clustering): You can enslave multiple machines (running Load Test) on your network to generate larger amounts of load than what a single machine can generate. Click on the Machines folder in the load test window and explore the GUI that appears. For each machine, you have the option for High Throughput mode, which generates higher load intensities using the same hardware by disabling certain response processing operations. See Running Load Tests on Remote Machines for details.
- User Profiles: Creating user profiles allows you to directly relate your load test back to your functional tests. This means that once you have created your functional tests, no further work is required to begin running it under load. Double-click the Profiles folder in the load test window and view each of the profiles that have been created.
- Custom Scenarios: Load Test provides four default load testing scenarios (Bell, Buffer Test, Linear Increase, and Steady Load) or allows you to create your own custom scenario. These scenarios can be created to emulate possible real life scenarios that may occur during normal usage. Click on the Scenarios folder and view the scenarios that are provided for this example.
- Monitors: Monitors can be added to Load Test to monitor various system resources as your load test occurs. Right-click on the Monitors folder to view the monitors that are available to be added. Load Test supports SNMP, Windows Perfmon, and JMX monitors. See Using Monitors for details.
| Scroll pdf ignore | ||||||||||
|---|---|---|---|---|---|---|---|---|---|---|
|
Common Workflow For Test Scenarios that Include Web Functional Tests
...
You can customize how a particular load test is run by customizing the profiles and scenarios you plan to use. You can determine the length of time a load test lasts, the distribution of virtual users, the hit rate over time and machines, and the distribution of user profiles over time.
| Scroll pdf ignore |
|---|
- Double-click the Profiles folder in the Load Tests tab and select one of the available test suite nodes. The configuration panel displays on the right.
- At the bottom of the panel, change the delay Value to 3 seconds. This may simulate how a user hesitates before making a decision about ordering a book.
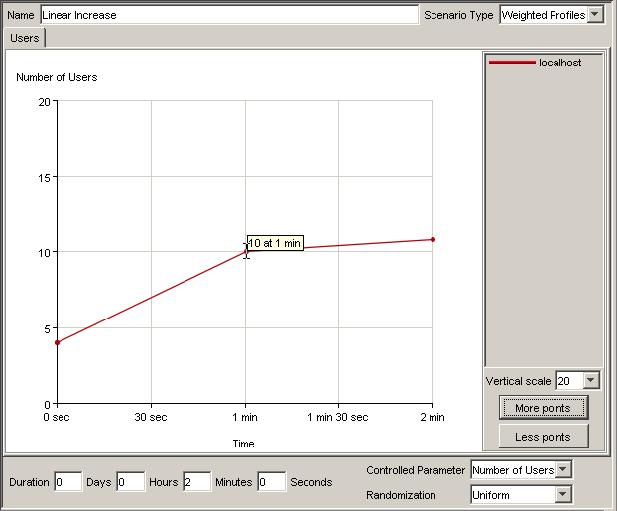
- Select Linear Increase beneath the Scenarios node. The Linear Increase scenario controls display in the Results panel and the User graph displays the localhost curve.
- Drag and drop the endpoint of the localhost curve to the coordinates of 10 users at 2 minutes.
- From the Vertical scale drop-down menu, select 20.
- Click the More Points button. A point will appear at the center of the localhost line.
- Click and drag the new point to the coordinates of 10 users at 1 minute.
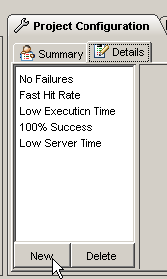
- Expand the Linear Increase node and select the QoS node beneath it. Summary and Details tabs display.
- Select the Details tab and click the New button.
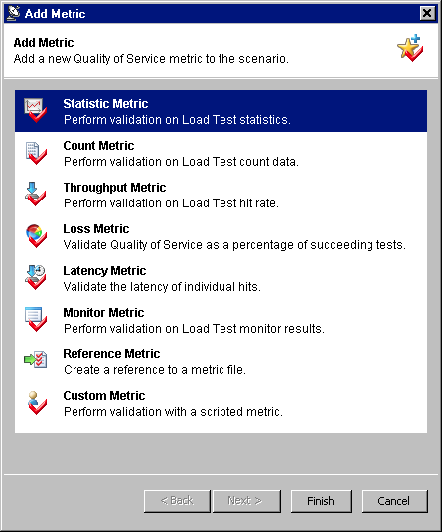
The Add Metric wizard displays. - Select Statistic Metric and click Finish.
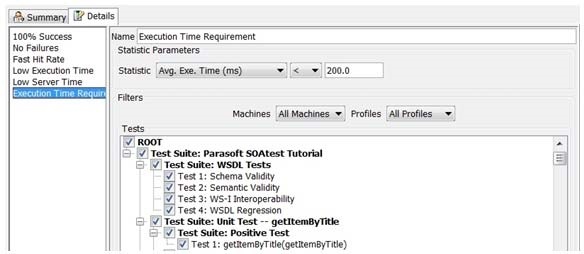
- In the metric configuration panel that opens, enter
Execution Time Requirementin the Name field. - For the Statistic drop-down menus in the right GUI, select Avg. Exe. Time (ms) and the less than symbol (<), and then enter 200 in the text field.
This will cause the load test result to "fail" if the execution time is measured above 200 milliseconds. For more information on configuring QoS metrics, see Customizing QoS Metrics for Scenarios. - Select the Linear Increase node beneath the Scenarios branch and click the Load Test toolbar button. Load Test will begin the customized load test and the Graph tab displays in the right GUI panel.
- Wait (2 minutes) for the load test to complete. While the load test is running, you can view various parameters within the Graph tab by selecting the appropriate checkboxes.
After the load test is complete, a Test Information summary is displayed in the right GUI panel which includes the name of the project, when the load test was started and finished, the scenario you chose, as well as any machines and profiles.
| Scroll pdf ignore | ||||||||||
|---|---|---|---|---|---|---|---|---|---|---|
Video Tutorial: Fine-tuning Load Test Configurations and Scenarios
|
Viewing Reports
Once the load test is completed, collected data must be analyzed in order to see how the application/service performed under load. Load Test gives you the ability to configure and generate load test reports.
...


