...
| Table of Contents | ||
|---|---|---|
|
Assignees -
...
Bar Chart
| Anchor | ||||
|---|---|---|---|---|
|


This widget shows the five users with the most violations assigned to them for the specified project in a table format.bar graph.
| Excerpt Include+ | ||||||||
|---|---|---|---|---|---|---|---|---|
|
Widget Configuration
| Scroll Table Layout | ||
|---|---|---|
|
| Title | Enter a new title to replace the default title that appears on the dashboard. | ||
|---|---|---|---|
| Filter | Choose Dashboard Settings to use the dashboard filter or choose a filter from the menu. | ||
| Severity | Choose a severity level to display from the menu. | ||
| Target Build | Choose a build from the menu. Only the data for this build will appear in the widget. | SeverityChoose a severity level to display from the menu. |
Actions
Click on an assignee a bar to open the Violations Explorer filtered by the selected assignee. See Violations Explorer.
Click the more... link to view the Assignees Violations by Assignee report. See Assignees Report.
...
| Code Block |
|---|
"name": "assignees", "type": "native", "uuid": "860837a0fe6a17ee-5949aab1-4504417c-9c8b93fa-db025673aaa5367e8e9b0154" |
Assignees -
...
Table
| Anchor | ||||
|---|---|---|---|---|
|
This widget shows the five users with the most violations assigned to them for the specified project in a bar graph.Excerpt Include+
Widget Configuration
| Scroll Table Layout | ||
|---|---|---|
|
| Title | Enter a new title to replace the default title that appears on the dashboard. |
|---|---|
| Filter | Choose Dashboard Settings to use the dashboard filter or choose a filter from the menu. |
| Choose a severity level to display from the menu. | |
| Target Build | Choose a build from the menu. Only the data for this build will appear in the widget. |
...
| Severity | Choose a severity level to display from the menu. |
|---|
Actions
Click on an assignee Click on a bar to open the Violations Explorer filtered by the selected assignee. See Violations Explorer.
Click the more... link to view the Violations by Assignee Assignees report. See Assignees Report.
...
| Code Block |
|---|
"name": "assignees", "type": "native", "uuid": "fe6a17ee860837a0-aab15949-417c4504-93fa9c8b-367e8e9b0154db025673aaa5" |
Authors -
...
Bar Chart
| Anchor | ||||
|---|---|---|---|---|
|


This widget shows the five authors with the most violations attributed to them for the selected projectin a bar graph.
| Excerpt Include+ | ||||||||
|---|---|---|---|---|---|---|---|---|
|
...
| Scroll Table Layout | ||
|---|---|---|
|
| Title | Enter a new title to replace the default title that appears on the dashboard. |
|---|---|
| Filter | Choose Dashboard Settings to use the dashboard filter or choose a filter from the menu. |
| Severity | Choose a severity level to display from the menu. |
| Target Build | Choose a build from the menu. Only the data for this build will appear in the widget. |
| Choose a severity level to display from the menu. |
Actions
Click on an author a bar to open the Violations Explorer filtered by the selected author. See Violations Explorer.
Click the more... link to view the Violations by Author report. See Authors Report.
...
| Code Block |
|---|
"name": "authors", "type": "native", "uuid": "2fb5db90aa4e8f70-d843e22e-47c64c7b-986b9b3b-fc24e5154d2db4b529af6aa0" |
Authors -
...
Table
| Anchor | ||||
|---|---|---|---|---|
|
This widget shows the five authors with the most violations in a bar graphattributed to them for the selected project.
| Excerpt Include+ | ||||||||
|---|---|---|---|---|---|---|---|---|
|
...
| Title | Enter a new title to replace the default title that appears on the dashboard. | ||
|---|---|---|---|
| Filter | Choose Dashboard Settings to use the dashboard filter or choose a filter from the menu. | Severity | Choose a severity level to display from the menu. |
| Target Build | Choose a build from the menu. Only the data for this build will appear in the widget. | ||
| Severity | Choose a severity level to display from the menu. |
Actions
Click on a bar an author to open the Violations Explorer filtered by the selected author. See Violations Explorer.
Click the more... link to view the Violations by Author report. See Authors Report.
...
| Code Block |
|---|
"name": "authors", "type": "native", "uuid": "aa4e8f702fb5db90-e22ed843-4c7b47c6-9b3b986b-b4b529af6aa0fc24e5154d2d" |
Files - Trend

Changed Violations - Statistics
| Anchor | ||||
|---|---|---|---|---|
|

This widget This widget shows the number of files failed (files containing violations) and the number of files passed (files without violations) over time. The failed files are represented with a red area, while a green area represents the passed files. Gaps in the blue line indicate that relevant data is missing for those builds.
| Excerpt Include+ | ||||||||
|---|---|---|---|---|---|---|---|---|
|
Widget Configuration
| Scroll Table Layout | ||
|---|---|---|
|
changed violations (new, fixed, existing, and total) between a baseline and target build.
Widget Configuration
| Scroll Table Layout | ||
|---|---|---|
|
| Title | Enter a new title to replace the default title that appears on the dashboard. |
|---|---|
| Filter | Choose Dashboard Settings to use the dashboard filter or choose a filter from the menu. |
| Period | Choose Dashboard Settings to use the dashboard date range or choose a period from the menu. |
Actions
Mouse over an area to see the number of files failed and passed and to see how many rules were enabled.
Click on the chart to open Violations Trend report. See Violations Trend Report.
...
| Baseline Build | Choose a build from the menu to set the initial data for comparison. |
|---|---|
| Target Build | Choose a build from the menu to serve as the current data for comparison. |
Actions
Click on a segment of the widget to view the new, fixed, existing, or total changed violations in the Violations Explorer.
Custom Dashboard Settings
You can add this widget to your custom dashboards by specifying the following properties in the dashboard definition JSON file (see Custom Dashboard Templates for details):
| Code Block |
|---|
"name" : "filesViolations_trendChanged", "type" : "native", "uuid": "90da2a8600c22f0e-ca528c18-4f1f11e6-85efae22-72d81e5af75956b6b6499611" |
Modules - Top 5 Table
Files - Trend
| Anchor | ||||
|---|---|---|---|---|
|

This widget shows the five modules with the most violations for the specified project. It also shows the change in number of violations from the baseline build to the target build specified in the Widget Configuration settings. Table cells in the # of Violations and Change columns are also color-coded.
- Red cells: The number of violations/new violations exceeds the upper-bound threshold.
- Green cells: The number of violations/new violations is less than the lower-bound threshold.
- Yellow cells: The number of violations/new violations is less than the upper-bound threshold, but exceeds the lower-bound threshold.
number of files failed (files containing violations) and the number of files passed (files without violations) over time. The failed files are represented with a red area, while a green area represents the passed files. Gaps in the blue line indicate that relevant data is missing for those builds.
| Excerpt Include+ | ||||||||
|---|---|---|---|---|---|---|---|---|
| Excerpt Include+ | ||||||||
|
Widget
...
Configuration
...
| Scroll Table Layout |
|---|
...
| Scroll Table Layout | ||
|---|---|---|
|
| Title | Enter a new title to replace the default title that appears on the dashboard. |
|---|---|
| Filter | Choose Dashboard Settings to use the dashboard filter or choose a filter from the menu. |
| Period | Choose Dashboard Settings to use the dashboard date range or choose a period from the menu. |
Actions
Click on a link in the Name column to open the Violations Explorer filtered by the selected module. See Violations Explorer.
Click the more... link to view the Violations by Module report. See Modules Report.
Custom Dashboard Properties
You can add this widget to your custom dashboards by specifying the following properties in the dashboard definition JSON file (see Custom Dashboard Templates for details):
| Code Block |
|---|
"name": "modules",
"type": "native",
"uuid": "3cdce929-da84-4279-a0af-90a133215120" |
My Violations - Summary

This widget shows total number of violations, as well as the change in number of violations, assigned to the signed-in user. You can change the dashboard or widget date range settings filter to view the difference between current total and total at beginning of the specified period.
| Excerpt Include+ | ||||||||
|---|---|---|---|---|---|---|---|---|
|
Widget Configuration
| Scroll Table Layout | ||
|---|---|---|
|
...
Actions
Mouse over an area to see the number of files failed and passed and to see how many rules were enabled.
Click on the chart to open Violations Trend report. See Violations Trend Report.
Custom Dashboard Properties
You can add this widget to your custom dashboards by specifying the following properties in the dashboard definition JSON file (see Custom Dashboard Templates for details):
| Code Block |
|---|
"name": "files_trend",
"type": "native",
"uuid": "90da2a86-ca52-4f1f-85ef-72d81e5af759" |
Modules - Table
| Anchor | ||||
|---|---|---|---|---|
|
This widget shows the five modules with the most violations for the specified project. It also shows the change in number of violations from the baseline build to the target build specified in the Widget Configuration settings. Table cells in the # of Violations and Change columns are also color-coded.
- Red cells: The number of violations/new violations exceeds the upper-bound threshold.
- Green cells: The number of violations/new violations is less than the lower-bound threshold.
- Yellow cells: The number of violations/new violations is less than the upper-bound threshold, but exceeds the lower-bound threshold.
| Excerpt Include+ | ||||||||
|---|---|---|---|---|---|---|---|---|
|
Widget Configuration
| Anchor | ||||
|---|---|---|---|---|
|
| Scroll Table Layout | ||
|---|---|---|
|
| Title | Enter a new title to replace the default title that appears on the dashboard. |
|---|---|
| Filter | Choose Dashboard Settings to use the dashboard filter or choose a filter from the menu. |
| Period | Choose Dashboard Settings to use the dashboard date range or choose a period from the menu. |
| Baseline Build | Choose a build from the menu to set the initial data for comparison. |
| Target Build | Choose a build from the menu to serve as the current data for comparison. |
| Severity | Choose a severity level to display from the menu. |
| Violation Upper Bound | Enter a value to determine an unacceptable number of violations per module. Values higher than this number will be color coded red. |
| Violation Lower Bound | Enter a value to determine an acceptable number of violations per module. Values lower than this number will be color coded green. |
| Change Upper Bound | Enter a value to determine an unacceptable number of new violations per module. Values higher than this number will be color coded red. |
| Change Lower Bound | Enter a value to determine an acceptable number of new violations per module. Values lower than this number will be color coded green. |
Actions
Click on a link in the Name column to open the Violations Explorer filtered by the selected module. See Violations Explorer.
Click the more... link to view the Violations by Module report. See Modules Report.
Actions
Click on a rule ID in the widget to open the violation Violations Explorer. See Violations Explorer.
Custom Dashboard Properties
You can add this widget to your custom dashboards by specifying the following properties in the dashboard definition JSON file (see Custom Dashboard Templates for details):
| Code Block |
|---|
"name": "my_violationsmodules", "type": "native", "uuid": "659a8d103cdce929-9bd8da84-4da94279-9e40a0af-02a7440c5d8190a133215120" |
My Violations
...
- Pie
...
Chart
| Anchor | ||||
|---|---|---|---|---|
|


This widget shows a pie chart of violations assigned to the signed-in user segmented by severity. The pie chart legend shows a count of violations by severity, as well as change in the number of violations during the date range specified in the widget settings.
...
Click on a pie segment or a severity level in the legend to open the Violations Explorer filtered by the selected severity. See Violations Explorer.
Custom Dashboard Properties
You can add this widget to your custom dashboards by specifying the following properties in the dashboard definition JSON file (see Custom Dashboard Templates for details):
| Code Block |
|---|
"name": "my_violations_by_severity_pie", "type": "native", "uuid": "21de9b86-1c35-457d-aa4e-4f65014a5a4c" |
Portfolio - Violations Statistics
My Violations - Summary
| Anchor | ||||
|---|---|---|---|---|
|

This widget shows total number of violations, as well as the change in number of violations for each project filter in your portfolio. Refer to the Configuring Portfolios section for details about configuring portfolios in DTP.
The widget shows the total number of violations and number of violations per severity. You can also configure the widget to include a column that shows the build ID associated with the filter.
You can also configure thresholds for the number of acceptable violations and apply the threshold across severities. When the threshold is applied to a severity or range of severities, a Status column appears in the widget. The Status column indicates three possible states for the code in the filter:
- A gray question mark indicates that no static analysis information is available for the filter.
- A red "x" indicates that the number of violations for one or more severity exceeds the configured threshold.
- A yellow exclamation mark indicates that the filter contains violations, but they are within the configured threshold.
- A green checkmark indicates that the code contains no violations for any severity level.

See Widget Configuration for details.
If you are a member of a project associated with a filter in the portfolio, you will see an entry in the widget for that filter. See Adding Teams to Projects for additional information about team membership or Permissions for information about built-in user permissions in DTP.
| Excerpt Include+ | ||||||||
|---|---|---|---|---|---|---|---|---|
|
...
| Scroll Table Layout | ||
|---|---|---|
|
...
Portfolio
...
Enter a build ID to use across all filters. If no build ID is specified, the latest build is used by default.
Refer to Build Administration for additional information about build IDs.
...
Choose Yes from the menu to include the Build column in the widget. The Build column shows the build ID specified in the Build field.
Choose No to hide the Build column. If the Build column is not included, you can view the build ID by hovering your pointer over a filter in the Filter column.
Refer to Build Administration for additional information about build IDs.
...
Choose the severities from the menu that the Violations for Severity Threshold should apply to. You can choose from the following options:
- 1: Threshold configured in the Violations for Severity Threshold setting will only apply to severity 1 violations.
- 1-2: Threshold configured in the Violations for Severity Threshold setting will only apply to severity 1 and 2 violations.
- 1-3: Threshold configured in the Violations for Severity Threshold setting will only apply to severity 1, 2, and 3 violations.
- 1-4: Threshold configured in the Violations for Severity Threshold setting will only apply to severity 1, 2, 3, and 4 violations.
- 1-5: Threshold configured in the Violations for Severity Threshold setting will only apply to all violations.
...
The DTP dashboard is a six-column wide grid that can have an unlimited number of rows. Specify how many columns the widget should span. Default is 3.
Also see About the Dashboard Grid.
...
The DTP dashboard is a six-column wide grid that can have an unlimited number of rows. Specify how many rows the widget should span. Default is 2.
Also see About the Dashboard Grid.
, assigned to the signed-in user. You can change the dashboard or widget date range settings filter to view the difference between current total and total at beginning of the specified period.
| Excerpt Include+ | ||||||||
|---|---|---|---|---|---|---|---|---|
|
Widget Configuration
| Scroll Table Layout | ||
|---|---|---|
|
| Title | Enter a new title to replace the default title that appears on the dashboard. |
|---|---|
| Filter | Choose Dashboard Settings to use the dashboard filter or choose a filter from the menu. |
| Period | Choose Dashboard Settings to use the dashboard date range or choose a period from the menu. |
| Baseline Build | Choose a build from the menu to set the initial data for comparison. |
| Target Build | Choose a build from the menu to serve as the current data for comparison. |
| Severity | Choose a severity level to display from the menu. |
Actions
Click on a rule ID in the widget to open the violation Violations Explorer. See Violations Explorer.
Custom Dashboard Properties
You can add this widget to your custom dashboards by specifying the following properties in the dashboard definition JSON file (see Custom Dashboard Templates for details):
| Code Block |
|---|
"name": "my_violations",
"type": "native",
"uuid": "659a8d10-9bd8-4da9-9e40-02a7440c5d81" |
Resource Groups - Table
| Anchor | ||||
|---|---|---|---|---|
|

A resource group is a collection of resources (files and/or folders). It is defined by a set of one or more Ant file patterns. This widget shows the five resource groups containing the most violations, as well as the number of changed files within each resource group.
| Excerpt Include+ | ||||||||
|---|---|---|---|---|---|---|---|---|
|
Widget Configuration
| Scroll Table Layout | ||
|---|---|---|
|
| Title | Enter a new title to replace the default title that appears on the dashboard. |
|---|---|
| Filter | Choose Dashboard Settings to use the dashboard filter or choose a filter from the menu. |
| Period | Choose Dashboard Settings to use the dashboard date range or choose a period from the menu. |
| Baseline Build | Choose a build from the menu to set the initial data for comparison. |
| Target Build | Choose a build from the menu to serve as the current data for comparison. |
| Severity | Choose a severity level from the menu. |
| Violation Upper Bound | Enter a value to determine an unacceptable number of violations per resource group. Values higher than this number will be color coded red. |
| Violation Lower Bound | Enter a value to determine an acceptable number of violations per resource group. Values lower than this number will be color coded green. |
| Change Upper Bound | Enter a value to determine an unacceptable number of new violations per resource group. Values higher than this number will be color coded red. |
| Change Lower Bound | Enter a value to determine an acceptable number of new violations per resource group. Values lower than this number will be color coded green. |
Actions
Click on a resource group name to open the Violations Explorer filtered according to the widget and/or dashboard settings. Click more... to open the Resource Groups Report
Actions
Click on a link to open the Violations Explorer view filtered by severity and project filter.
Click on a column header to sort the data.
Custom Dashboard Properties
You can add this widget to your custom dashboards by specifying the following properties in the dashboard definition JSON file (see Custom Dashboard Templates for details):
| Code Block |
|---|
"name": "Portfolio.ViolationResource_StatisticsGroups", "type": "native", "uuid": "d1cb1fd4137410a7-ef18f8a5-419b4aaf-926081ed-65c9901ba85883caa518c1e2" |
Resource Groups -
...
Tree Map
| Anchor | ||||
|---|---|---|---|---|
|

A resource group is a collection of resources (files and/or folders). It is defined by a set of one or more Ant file patterns. This widget shows displays the five ten resource groups containing with the most violations , as well as the number of changed files within each resource groupin a tree map display. The largest tile with the deepest color represents the resource group with the most violations.
| Excerpt Include+ | ||||||||
|---|---|---|---|---|---|---|---|---|
|
Widget Configuration
| Scroll Table Layout | ||
|---|---|---|
|
| Title | Enter a new title to replace the default title that appears on the dashboard. |
|---|---|
| Filter | Choose Dashboard Settings to use the dashboard filter or choose a filter from the menu. |
| Period | Choose Dashboard Settings to use the dashboard date range or choose a period from the menu. |
| Baseline Target Build | Choose a build from the menu to set . Only the initial data for comparisonthis build will appear in the widget. | Target Build
Actions
...
Click on a tile to open the Violations Explorer filtered according to the widget and/or dashboard settings. Click more... to open the Resource Groups Report.
Custom Dashboard Settings
You can add this widget to your custom dashboards by specifying the following properties in the dashboard definition JSON file (see Custom Dashboard Templates for details):
| Code Block |
|---|
"name": "Resource_Groups",
"type": "native",
"uuid": "867f98d0-b239-4329-821a-bc89270dcad9" |
Resource Groups - Trend
| Anchor | ||||
|---|---|---|---|---|
|
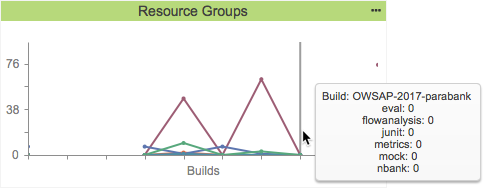
A resource group is a collection of resources (files and/or folders). It is defined by a set of one or more Ant file patterns. This widget shows the change in number of violations associated with a build per resource group over time. Each resource group associated with the current filter is represented as a colored line.
| Excerpt Include+ | ||||||||
|---|---|---|---|---|---|---|---|---|
|
Widget Configuration
| Scroll Table Layout | ||
|---|---|---|
|
| Title | Enter a new title to replace the default title that appears on the dashboard. |
|---|---|
| Filter | Choose Dashboard Settings to use the dashboard filter or choose a filter from the menu. |
| Period | Choose Dashboard Settings to use the dashboard date range or choose a period from the menu. |
Actions
Click on the widget to open the Resource Groups Report filtered by build ID. Mouse over a node to view details about the resource groups.
Custom Dashboard Settings
Actions
Click on a resource group name to open the Violations Explorer filtered according to the widget and/or dashboard settings. Click more... to open the Resource Groups Report.
...
You can add this widget to your custom dashboards by specifying the following properties in the dashboard definition JSON file (see Custom Dashboard Templates for details):
| Code Block |
|---|
"name": "Resource_Groups", "type": "native", "uuid": "137410a79cd2cd4e-f8a56a14-4aaf4050-81ed93a6-83caa518c1e2ee0673078ed0" |
Resource Groups - Trend
Rules - Trend
| Anchor | ||||
|---|---|---|---|---|
|

A resource group is a collection of resources (files and/or folders). It is defined by a set of one or more Ant file patterns. This widget shows the change in number of violations associated with a build per resource group over time. Each resource group associated with the current filter is represented as a colored linestatic analysis rules enabled over time. Mouse over an area to see how many rules were enabled. The trend line will have a gap if a build does not have static analysis data.
| Excerpt Include+ | ||||||||
|---|---|---|---|---|---|---|---|---|
|
Widget Configuration
| Scroll Table Layout | ||
|---|---|---|
|
| Title | Enter a new title to replace the default title that appears on the dashboard. |
|---|---|
| Filter | Choose Dashboard Settings to use the dashboard filter or choose a filter from the menu. |
| Period | Choose Dashboard Settings to use the dashboard date range or choose a period from the menu. |
Actions
Click on the widget chart to open the Resource Groups Report filtered by build ID. Mouse over a node to view details about the resource groupsViolations Trend report. See Violations Trend Report.
Custom Dashboard
...
Properties
You can add this widget to your custom dashboards by specifying the following properties in the dashboard definition JSON file (see Custom Dashboard Templates for details):
| Code Block |
|---|
"name": "Resource_Groupsrules", "type": "native", "uuid": "9cd2cd4e5b7a0937-6a14d6df-40504dd8-93a6a317-ee0673078ed0240abbfb4173" |
Resource Groups - Top 10 Tree Map
A resource group is a collection of resources (files and/or folders). It is defined by a set of one or more Ant file patterns. This widget displays the ten resource groups with the most violations in a tree map display. The largest tile with the deepest color represents the resource group with the most violations.
Severities - Pie Chart
| Anchor | ||||
|---|---|---|---|---|
|

This widget shows a color-coded pie chart of violations segmented by severity. The chart legend shows the count of violations per severity, as well as change in the number of violations during the date range specified in the widget settings.Excerpt Include+
Widget Configuration
| Scroll Table Layout | ||
|---|---|---|
|
| Title | Enter a new title to replace the default title that appears on the dashboard. |
|---|---|
| Filter | Choose Dashboard Settings to use the dashboard filter or choose a filter from the menu. |
| Period | Choose Dashboard Settings to use the dashboard date range or choose a period from the menu. |
| Baseline Build | Choose a build from the menu |
| to set the initial data for | |
| comparison. | |
| Target Build | Choose a build from the menu to serve as the current data for comparison. |
Actions
Click on a tile to open the Violations Explorer filtered according to the widget and/or dashboard settings. Click more... to open the Resource Groups Reportpie segment or a severity level in the legend to open the Violations Explorer filtered by the selected severity. See Violations Explorer.
Custom Dashboard
...
Properties
You can add this widget to your custom dashboards by specifying the following properties in the dashboard definition JSON file (see Custom Dashboard Templates for details):
| Code Block |
|---|
"name": "Resource_Groupsviolations_by_severity_pie", "type": "native", "uuid": "867f98d04e83542c-b239d881-43294aeb-821a9788-bc89270dcad9" |
Rules - Trend
This widget shows the number of static analysis rules enabled over time. Mouse over an area to see how many rules were enabled. The trend line will have a gap if a build does not have static analysis data.
| Excerpt Include+ | ||||||||
|---|---|---|---|---|---|---|---|---|
|
Widget Configuration
| Scroll Table Layout | ||
|---|---|---|
|
...
a882864be6c8" |
Severities - Pyramid
| Anchor | ||||
|---|---|---|---|---|
|
| Scroll Only |
|---|
|
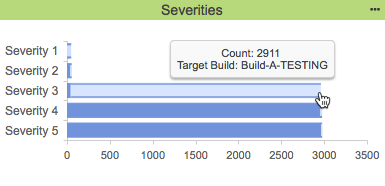
This widget shows the cumulative number of violations across severity levels. Severity levels are listed along the y-axis. The x-axis shows the violation count. The light blue segment represents the number of violations reported for the current severity level in the y-axis. The dark blue segment represents the cumulative number violations beginning with the top-most severity level in the y-axis.
| Scroll Ignore |
|---|
|

In the example above, the Count segment (light blue) for the Severity 1 row shows 43 violations. The Count segment for Severity 2 violations shows 3 violations. The Aggregation of previous values segment (dark blue) in the Severity 3 violations row includes the count of Severity 1 violations (43) and the count of Severity 2 violations (3) to show 46 violations.
The widget also reports 2911 Severity 3 violations. These violations are added to the 46 Severity 1 and 2 violations and shown in the Aggregation of previous values segment of the Severity 4 violations row for a total of 2957 violations. Finally, there are 13 Severity 4 violations, which are added to the Aggregation of previous values segment (Severity 1, 2, and 3: 2957 violations) and reported in the Aggregation of previous values segment in the Severity 5 violations row for a total of 2970 violations.
| Excerpt Include+ | ||||||||
|---|---|---|---|---|---|---|---|---|
|
Widget Configuration
| Scroll Table Layout | ||
|---|---|---|
|
| Title | Enter a new title to replace the default title that appears on the dashboard. |
|---|---|
| Filter | Choose Dashboard Settings to use the dashboard filter or choose a filter from the menu. |
| Target Build | Choose a build from the menu. Only the data for this build will appear in the widget. |
Actions
Click on a segment to open the Violations Explorer filtered by the severity. See Violations Explorer.
Custom Dashboard Properties
You can add this widget to your custom dashboards by specifying the following properties in the dashboard definition JSON file (see Custom Dashboard Templates for details):
| Code Block |
|---|
"name": "severities",
"type": "native",
"uuid": "15281c38-874e-44a6-b150-d09bf5a39fcb" |
Severities - Sunburst
| Anchor | ||||
|---|---|---|---|---|
|
| Scroll Only |
|---|
|

| Scroll Ignore |
|---|
|

This widget shows an interactive, multi-tiered graph of violations grouped by severity, rule category, and rule ID.
Actions
Click on the chart to open Violations Trend report. See Violations Trend Report.
Custom Dashboard Properties
You can add this widget to your custom dashboards by specifying the following properties in the dashboard definition JSON file (see Custom Dashboard Templates for details):
| Code Block |
|---|
"name": "rules",
"type": "native",
"uuid": "5b7a0937-d6df-4dd8-a317-240abbfb4173" |
Severities - Pyramid
| Scroll Only |
|---|
|
This widget shows the cumulative number of violations across severity levels. Severity levels are listed along the y-axis. The x-axis shows the violation count. The light blue segment represents the number of violations reported for the current severity level in the y-axis. The dark blue segment represents the cumulative number violations beginning with the top-most severity level in the y-axis.
| Scroll Ignore |
|---|
|
In the example above, the Count segment (light blue) for the Severity 1 row shows 43 violations. The Count segment for Severity 2 violations shows 3 violations. The Aggregation of previous values segment (dark blue) in the Severity 3 violations row includes the count of Severity 1 violations (43) and the count of Severity 2 violations (3) to show 46 violations.
The widget also reports 2911 Severity 3 violations. These violations are added to the 46 Severity 1 and 2 violations and shown in the Aggregation of previous values segment of the Severity 4 violations row for a total of 2957 violations. Finally, there are 13 Severity 4 violations, which are added to the Aggregation of previous values segment (Severity 1, 2, and 3: 2957 violations) and reported in the Aggregation of previous values segment in the Severity 5 violations row for a total of 2970 violations.
| Excerpt Include+ | ||||||||
|---|---|---|---|---|---|---|---|---|
|
Widget Configuration
| Scroll Table Layout | ||
|---|---|---|
|
| Title | Enter a new title to replace the default title that appears on the dashboard. |
|---|---|
| Filter | Choose Dashboard Settings to use the dashboard filter or choose a filter from the menu. |
| Target Build | Choose a build from the menu. Only the data for this build will appear in the widget. |
Actions
| title that appears on the dashboard. | |
| Filter | Choose Dashboard Settings to use the dashboard filter or choose a filter from the menu. |
|---|---|
| Target Build | Choose a build from the menu. Only the data for this build will appear in the widget. |
Actions
The innermost ring represents severity. Click on a severity to show only the violations with the same severity level. Click the center of the sunburst to return to the previous view.
The second ring represents violation categories. Click on a category to show violations of all severity levels and rule IDs in the selected category. Click the center of the sunburst to return to the previous view.
The outermost ring shows violations grouped by rule ID. Click on an ID Click on a segment to open the Violations Explorer filtered by the severityselected rule. See Violations Explorer.
Custom Dashboard Properties
You can add this widget to your custom dashboards by specifying the following properties in the dashboard definition JSON file (see Custom Dashboard Templates for details):
| Code Block |
|---|
"name": "severities_sunburst", "type": "native", "uuid": "15281c385fd2f94a-874e1544-44a64756-b150a55e-d09bf5a39fcbc2526a3405b8" |
Severities - Pie

This widget shows a color-coded pie chart of violations segmented by severity. The chart legend shows the count of violations per severity, as well as change in the number of violations during the date range specified in the widget settings.
Widget Configuration
| Scroll Table Layout | ||
|---|---|---|
|
...
Violation Statistics - Portfolio
| Anchor | ||||
|---|---|---|---|---|
|

This widget shows the number of violations for each project filter in your portfolio. Refer to the Configuring Portfolios section for details about configuring portfolios in DTP.
The widget shows the total number of violations and number of violations per severity. You can also configure the widget to include a column that shows the build ID associated with the filter.
You can also configure thresholds for the number of acceptable violations and apply the threshold across severities. When the threshold is applied to a severity or range of severities, a Status column appears in the widget. The Status column indicates three possible states for the code in the filter:
- A gray question mark indicates that no static analysis information is available for the filter.
- A red "x" indicates that the number of violations for one or more severity exceeds the configured threshold.
- A yellow exclamation mark indicates that the filter contains violations, but they are within the configured threshold.
- A green checkmark indicates that the code contains no violations for any severity level.

See Widget Configuration for details.
If you are a member of a project associated with a filter in the portfolio, you will see an entry in the widget for that filter. See Adding Teams to Projects for additional information about team membership or Permissions for information about built-in user permissions in DTP
Actions
Click on a pie segment or a severity level in the legend to open the Violations Explorer filtered by the selected severity. See Violations Explorer.
Custom Dashboard Properties
You can add this widget to your custom dashboards by specifying the following properties in the dashboard definition JSON file (see Custom Dashboard Templates for details):
| Code Block |
|---|
"name": "violations_by_severity_pie",
"type": "native",
"uuid": "4e83542c-d881-4aeb-9788-a882864be6c8" |
Severities - Sunburst
| Scroll Only |
|---|
|
| Scroll Ignore |
|---|
|
This widget shows an interactive, multi-tiered graph of violations grouped by severity, rule category, and rule ID.
| Excerpt Include+ | ||||||||
|---|---|---|---|---|---|---|---|---|
|
| Anchor | ||||
|---|---|---|---|---|
|
| Scroll Table Layout | ||
|---|---|---|
|
| Title | Enter a new |
|---|
Actions
The innermost ring represents severity. Click on a severity to show only the violations with the same severity level. Click the center of the sunburst to return to the previous view.
The second ring represents violation categories. Click on a category to show violations of all severity levels and rule IDs in the selected category. Click the center of the sunburst to return to the previous view.
The outermost ring shows violations grouped by rule ID. Click on an ID to open the Violations Explorer filtered by the selected rule. See Violations Explorer.
Custom Dashboard Properties
You can add this widget to your custom dashboards by specifying the following properties in the dashboard definition JSON file (see Custom Dashboard Templates for details):
| Code Block |
|---|
"name": "severities_sunburst",
"type": "native",
"uuid": "5fd2f94a-1544-4756-a55e-c2526a3405b8" |
...

This widget shows the current number of violations or suppressions reported in the target build for all or severities or a specific severity and all actions or a specific action. It also shows the change from the baseline build. You can use multiple instances of the widget to provide an overarching view of the change in violations in your project.
Widget Configuration
| Scroll Table Layout | ||
|---|---|---|
|
...
| title to replace the default title that appears on the dashboard. | |
Portfolio | Choose the name of the portfolio from the menu. See Configuring Portfolios for additional information. |
|---|---|
| Build | Enter a build ID to use across all filters. If no build ID is specified, the latest build is used by default. Refer to Build Administration for additional information about build IDs. |
| Show Build Column | Choose Yes from the menu to include the Build column in the widget. The Build column shows the build ID specified in the Build field. Choose No to hide the Build column. If the Build column is not included, you can view the build ID by hovering your pointer over a filter in the Filter column. Refer to Build Administration for additional information about build IDs. |
| Set violations for threshold severity | Specify the number of static analysis violations that are acceptable for each filter. The value applies to all severities configured in the Severities to apply to threshold setting and only takes effect if one or more severities are configured. |
| Violation threshold | Choose the severities from the menu that the Violations for Severity Threshold should apply to. You can choose from the following options:
|
| Width | The DTP dashboard is a six-column wide grid that can have an unlimited number of rows. Specify how many columns the widget should span. Default is Also see About the Dashboard Grid. |
| Height | The DTP dashboard is a six-column wide grid that can have an unlimited number of rows. Specify how many rows the widget should span. Default is Also see About the Dashboard Grid. |
Actions
Click on a link to open the Violations Explorer view filtered by severity and project filter.
Click on a column header to sort the data
Actions
Click on the widget to open the Violations Explorer. See Violations Explorer.
Custom Dashboard Properties
You can add this widget to your custom dashboards by specifying the following properties in the dashboard definition JSON file (see Custom Dashboard Templates for details):
| Code Block |
|---|
"name": "violationsPortfolio.Violation_Statistics", "type": "native", "uuid": "62cb0f66d1cb1fd4-ef18-bbb5419b-4de3-910c-b70b2e6528a1" |
Violations Trend
9260-65c9901ba858" |
Violations - Summary Trend
| Anchor | ||||
|---|---|---|---|---|
|

This widget shows the current number of new and remaining violations over time. The red area represents the new violations violations or suppressions reported in the target build . The blue area represents the number of violations remaining from the previous build. If static analysis data was not reported for a build, a gap in the dark blue trend line will appearfor all or severities or a specific severity and all actions or a specific action. It also shows the change from the baseline build. You can use multiple instances of the widget to provide an overarching view of the change in violations in your project.
Widget Configuration
| Scroll Table Layout | ||
|---|---|---|
|
| Title | Enter a new title to replace the default title that appears on the dashboard. |
|---|---|
| Filter | Choose Dashboard Settings to use the dashboard filter or choose a filter from the menu. |
| Period | Choose Dashboard Settings to use |
| the dashboard date range or choose a period from the menu. | |
| Baseline Build | Choose a build from the menu to set the initial data for comparison. |
|---|---|
| Target Build | Choose a build from the menu to serve as the current data for comparison. |
| Severity | Choose a severity level from the menu by which to filter violations. Choose All to show all severities. |
| Type | Choose Violations or Suppressions from the menu to show either violations or suppressed violations in the widget. |
| Action | Choose an action from the menu by which to filter violations. Choose All to show all actions. |
Actions
Click on the chart widget to open the Violations Trend reportExplorer. See Violations Trend Report.Mouse over an area to see the number of new and remaining violations and how many rules were enabledExplorer.
Custom Dashboard Properties
You can add this widget to your custom dashboards by specifying the following properties in the dashboard definition JSON file (see Custom Dashboard Templates for details):
| Code Block |
|---|
"name": "violations", "type": "native", "uuid": "c82001e262cb0f66-fe02bbb5-4a514de3-88e5910c-81704732dca6b70b2e6528a1" |
Violations
...
per Assignee - Summary
| Anchor | ||||
|---|---|---|---|---|
|


This widget shows the average number of changed violations (new, fixed, existing, and total) between a baseline and target build.violations per assignee for all severities or for a specific severity reported for the target build. It also shows the change in violations since the baseline build. You can add multiple instances of the widget for greater visibility into each severity.
Widget Configuration
| Scroll Table Layout | ||
|---|---|---|
|
| Title | Enter a new title to replace the default title that appears on the dashboard. |
|---|---|
| Filter | Choose Dashboard Settings to use the dashboard filter or choose a filter from the menu. |
| Period | Choose Dashboard Settings to use the dashboard date range or choose a period from the menu. |
| Baseline Build | Choose a build from the menu to set the initial data for comparison. |
| Target Build | Choose a build from the menu to serve as the current data for comparisonfor comparison. |
| Severity | Choose a severity level from the menu. |
Actions
Click on a segment of the widget to view the new, fixed, existing, or total changed violations in the Violations Explorer. open the Violations by Author report. See Assignees Report.
Custom Dashboard
...
Properties
You can add this widget to your custom dashboards by specifying the following properties in the dashboard definition JSON file (see Custom Dashboard Templates for details):
| Code Block |
|---|
"name" : "Violations_Changedstatic_analysis.violations_per_assignee.summary", "type" : "native ", "uuid": "00c22f0ef352662a-8c18c64f-11e643cf-ae2293e2-56b6b6499611cae132e1cd1a" |
Violations
...
Trend
| Anchor | ||||
|---|---|---|---|---|
|
This widget shows the number of new and remaining violations over time. The red area represents the new violations reported in the build. The blue area represents the number of violations remaining from the previous build. If static analysis data was not reported for a build, a gap in the dark blue trend line will appear.
This widget shows the average number of violations per assignee for all severities or for a specific severity reported for the target build. It also shows the change in violations since the baseline build. You can add multiple instances of the widget for greater visibility into each severity.
Widget Configuration
| Scroll Table Layout | ||
|---|---|---|
|
| Title | Enter a new title to replace the default title that appears on the dashboard. |
|---|---|
| Filter | Choose Dashboard Settings to use the dashboard filter or choose a filter from the menu. |
| Period | Choose Dashboard Settings to use the dashboard date range or choose a period from |
| the menu. | |
| Baseline Build | Choose a build from the menu to |
|---|
| set the beginning of the range of data you want to view. |
Actions
Click on the widget chart to open the Violations by Author Trend report. See Assignees Report Violations Trend Report.
Mouse over an area to see the number of new and remaining violations and how many rules were enabled.
Custom Dashboard Properties
You can add this widget to your custom dashboards by specifying the following properties in the dashboard definition JSON file (see Custom Dashboard Templates for details):
| Code Block |
|---|
"name": "static_analysis.violations_per_assignee.summary", "type": "native ", "uuid": "f352662ac82001e2-c64ffe02-43cf4a51-93e288e5-cae132e1cd1a81704732dca6" |