You can create monitors and use them to collect network information and system performance data during load testing. Monitoring metrics can be overlaid onto load test results to help you determine whether the load passed to the Web server is being handled as designed.
In this section:
| Table of Contents | ||
|---|---|---|
|
Supported Monitors
- SNMP
- Windows monitors (available only on Windows installations of Load Test)
- WebSphere
- JBoss
- Tomcat
- rstat
- remote
- deployed (e.g., AppDynamics, Dynatrace)
- custom
| Info | ||
|---|---|---|
| ||
A performance monitor for Oracle Service Bus (OSB/ALSB) is available. Contact technical support for details. |
| Anchor | ||||
|---|---|---|---|---|
|
You can add the following built-in monitors.
| Table of Content Zone | ||||||||||||||||||||||
|---|---|---|---|---|---|---|---|---|---|---|---|---|---|---|---|---|---|---|---|---|---|---|
| ||||||||||||||||||||||
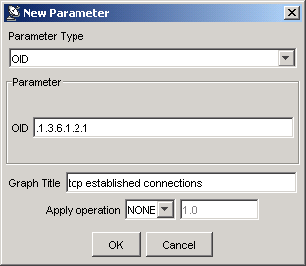
Adding SNMP Agent MonitorsLoad Test can retrieve data based on the provided OID(s) from the SNMP agents of versions 1 and 2c. To add an SNMP agent monitor:
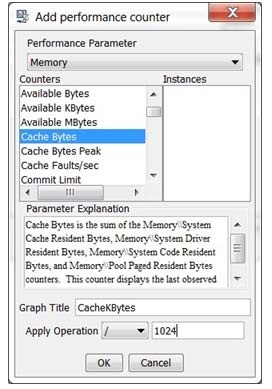
Adding Windows Performance MonitorsTo add a Windows performance monitor (functionality which is only available if you have a Windows installation of Load Test):
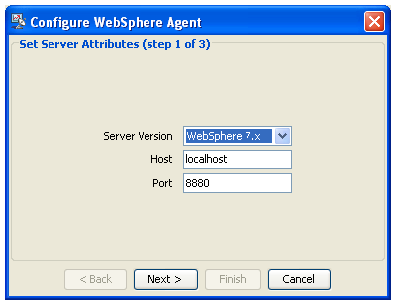
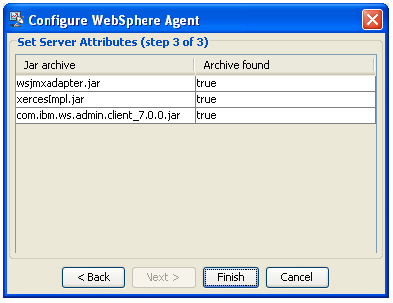
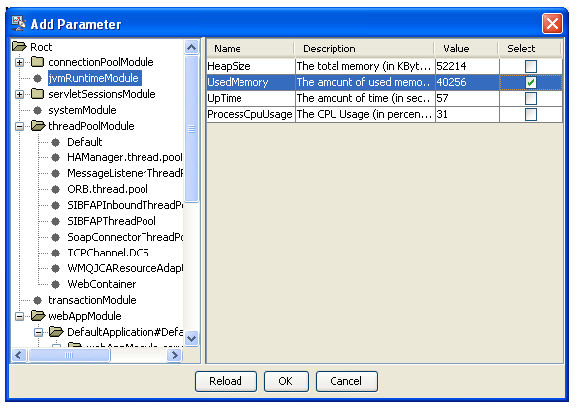
Adding WebSphere MonitorsBefore adding a WebSphere monitor, go to the Security> Global security section of the WebSphere Administrative console and ensure that the Enable administrative security check box is unselected. To add a WebSphere monitor:
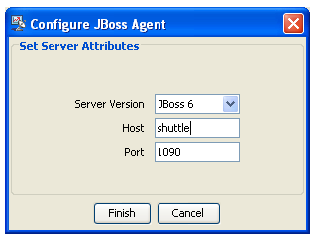
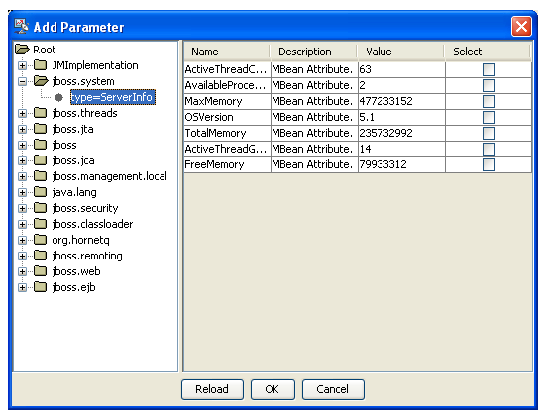
Adding JBoss MonitorsTo add a JBoss monitor:
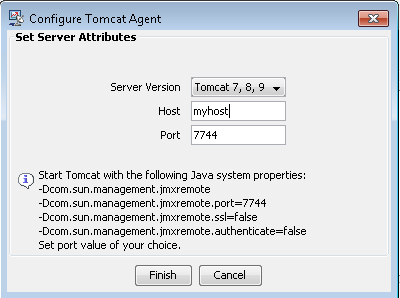
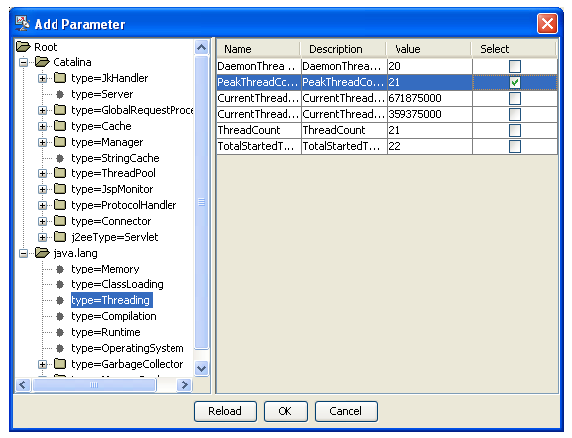
Adding Tomcat Monitors
To add a Tomcat monitor:
Adding rstat MonitorsTo add an rstat monitor:
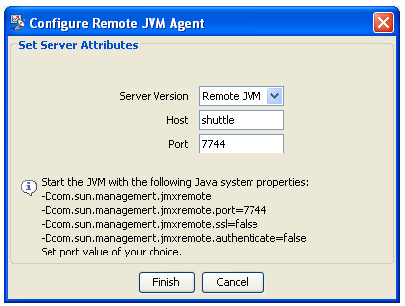
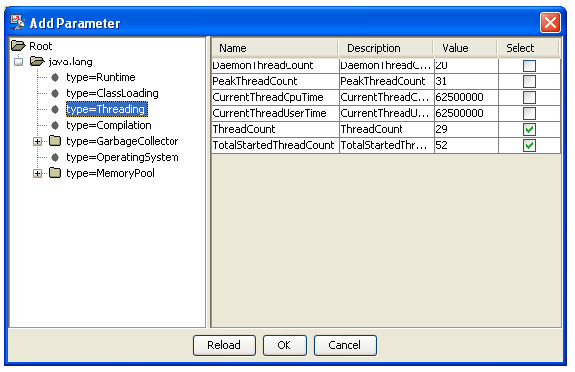
Adding Remote JVM Monitors
To add a remote JVM Monitor:
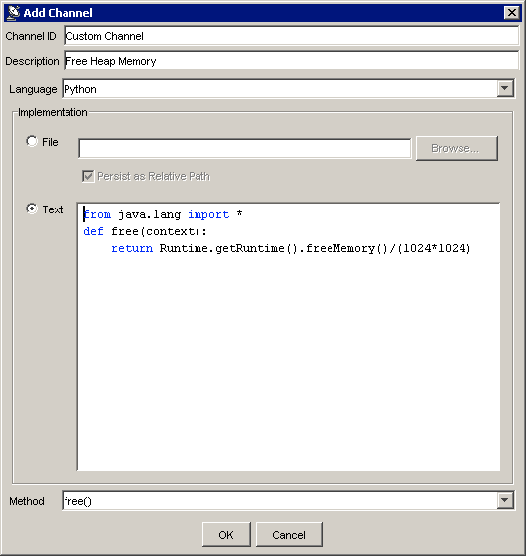
Adding Custom MonitorsCustom monitors can be implemented by JavaScript or Jython scripts, or by Java class methods. This is especially useful if you would like to collect data from sources that are not listed above.
To add a custom monitor:
|
Modifying Built-In Monitors
After a monitor has been created, you can set or modify the Apply Operation parameter for the following built-in monitor types:
- Windows
- JBoss
- Tomcat
- Remote JVM
- SNMP
To modify the operation, double-click the monitor channel in the Parameters panel of the monitor configuration view and set the appropriate operation type and value.
Adding Deployed Monitors
Load Test allows dynamically adding monitor types to the Load Test installation. Deployed monitors are displayed in the Deployed monitor types table of the Performance Monitors wizard.
| Table of Content Zone | |||||||||||||||||||||||||||||||||||||||||||||||||||||||||||||||||||||||||||||||||||||||||
|---|---|---|---|---|---|---|---|---|---|---|---|---|---|---|---|---|---|---|---|---|---|---|---|---|---|---|---|---|---|---|---|---|---|---|---|---|---|---|---|---|---|---|---|---|---|---|---|---|---|---|---|---|---|---|---|---|---|---|---|---|---|---|---|---|---|---|---|---|---|---|---|---|---|---|---|---|---|---|---|---|---|---|---|---|---|---|---|---|---|
| |||||||||||||||||||||||||||||||||||||||||||||||||||||||||||||||||||||||||||||||||||||||||
AppDynamicsAdding AppDynamics MonitorsTo add an AppDynamics monitor:
Monitoring Data Available from AppDynamics Monitoring ExtensionsThe AppDynamics Exchange site offers a number of Monitoring Extensions. Monitoring Extension data available in AppDynamics Metric Browser will be available in the Load Test AppDynamics monitor. The screenshots below show the data exposed by the ‘Static’ Monitoring Extension available from the Exchange in the AppDynamics Metric Browser View and the Load Test AppDynamics monitor channel selection view. Custom FileContentMetric in AppDynamics: DynatraceAdding Dynatrace MonitorsTo add a Dynatrace monitor:
The monitor channel selection view tree is structured in the following way:
You can monitor either existing Chart Dashlets of Line Chart type or create new ones. You can add multiple Measures (data series) to a Chart Dashlet. See the Dynatrace vendor documentation for more details.
Dynatrace REST Query Response Size ConsiderationsThe sizes of the Dynatrace REST responses can be quite large (100KB and more), depending on the Chart and Dashboard configurations. To minimize the size of the Dynatrace REST query responses:
Monitoring Data Available from Dynatrace PluginsThe Dynatrace ‘PLUGIN CENTRAL’ site and ‘Community Plugins and Extensions’ site contain a number of plugins, many of which can be used to extend the out-of-the box Dynatrace monitoring capabilities. The Dynatrace plugin data added as a Measure to a Chart Dashlet will be available in the Load Test Dynatrace monitor. The screenshots below show a StockQuote sample monitor plugin available from the ‘Community Plugins and Extensions’ site added as Measure in a Dynatrace Chart Dashlet and in Load Test Dynatrace monitor channel selection view. Custom StockQuote Measure in Dynatrace: JVM ThreadsAdding Remote JVM Threads MonitorsThe JVM Threads Monitor allows you to observe threads statistics, as well as record individual thread details of a remote Java application using Java JMX technology.
To add a Remote JVM Threads Monitor
About Channel Descriptors
All data returned by monitor channels is related to the last Load Test data collection interval. The NEW, RUNNABLE, BLOCKED, WAITING, TIMED_WAITING, TERMINATED are the states from the For details about JVM thread states, see the Java documentation for relevant Java classes:
Upon initialization, the JMX Threads Monitor checks if thread contention monitoring is enabled on a remote JVM. If contention monitoring is disabled, the JMX Threads Monitor attempts to enable it. If this attempt fails, the BlockedTime, BlockedRatio, WaitedTime and WaitedRatio channels will return zero values. Taking Selective Thread DumpsThe JMX Threads Monitor allows you to take selective dumps of a remote application's threads and save them to disk for further analysis. This feature helps you catch undesired thread states that appear sporadically or record thread states during the automated load test runs. The JMX Threads Monitor will only dump threads when a load test is running. Thread dumps will not be taken when clicking Send Request in the monitor configuration view. Set the following monitor properties to configure selective thread dumps.
Examining Thread DumpsThe path provided in the Thread Dump Directory setting will be used as a thread dump root. The JVM Threads Monitor will create a separate project thread dump directory under the thread dump root for each load test run. These project thread dump directories will have the following name pattern: PROJECTNAME_YYYY-MM-DD_hh-mm-ss.
This format allows you to clearly see which Load Test project a thread dump is related to and when it was created. The PROJECTNAME_YYYY-MM-DD_hh-mm-ss directory will not be created if the monitor does not find threads to dump that match the threads dump configuration during a load test run. The monitor will create thread dump files with the following name pattern inside the project thread dump directory: S..S_hh-mm-ss.txt
Each thread dump file will contain one or more thread stack traces taken by the monitor. A thread stack trace will have the following format:
Each BLOCKED thread will be followed by a stack trace of the thread that is blocking it. A BLOCKED thread output will have the following format:
Example:
Matching Thread Dumps to Graph Points in the Load Test ReportTo find a thread dump for a particular point in the Load Test report graph follow there steps:
For example, the 3_10-37-37.txt file will be the thread dump file for the graph point highlighted in the screenshot. |
Querying Monitors
Once some parameters have been added to a monitor, they can be queried.
To send a query:
- Select the Load Tests tree node that represents the monitor you want to query.
- Click the Send Request button in the Response View area of the monitor’s configuration panel.
Query results will be displayed in the Response View area of the monitor’s configuration panel.
Verifying Monitor Status
The Load Tests tree uses color bubbles to indicate the status of each monitor. The following colors are used:
- White: Unchecked.
- Green: All parameters are available.
- Yellow: Some parameters are either unavailable, or their values are not numeric.
- Red: Monitor is unavailable or unreachable.
To verify the current state of one or more monitors:
- Right-click the Load Tests tree node that represents the monitor(s) you want to verify (either the Monitors node, the Windows node, the SNMP node, the Custom node, or the node that represents an individual monitor).
- Choose Verify from the shortcut menu.
Monitoring Behavior During Test Suite Load Testing
The monitors that you have added to the Load Tests tree will be used during test suite load testing.
During a load test that uses monitors, Load Test adds a bar for each monitor within the Graph tab of the Load Test Progress panel. The Graph tab displays data collected from the monitors. The names of these bars are based on the monitors’ Graph Title values, not by OID numbers or parameter IDs.
Accessing Monitor Results
Monitor data collected during load testing is saved in the Detailed Report, where it can be viewed together with and correlated to the default data (such as "Number of Virtual Users", etc.)
