...
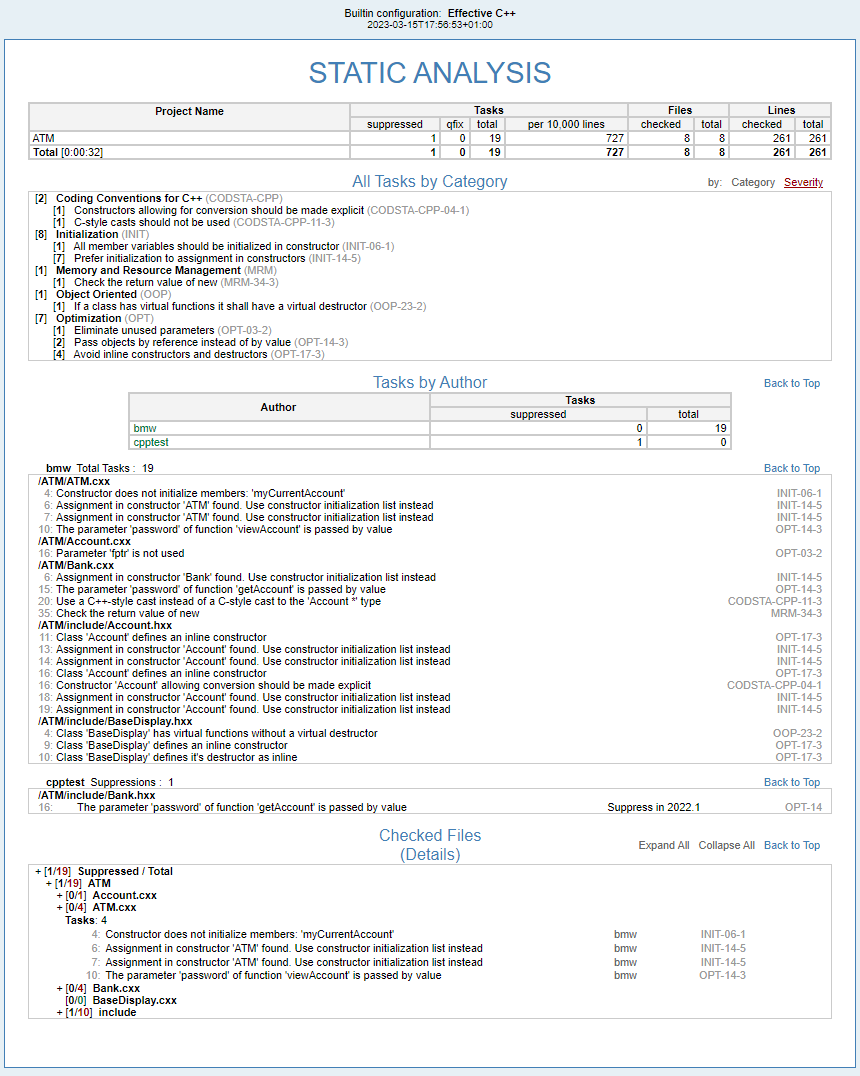
- The first section is an overview of tasks for the tested project(s). It shows the total number of static analysis tasks per project, the number of tasks associated with suppressed rules, the number of checked files, and the total analysis time.
- The All Tasks section displays the details of tasks organized by category or severity. Click the Severity or Category link to toggle between the views.
- The Tasks by Author section includes a table of authors associated with the analyzed code and a count of tasks per each author. The table shows tasks associated with the suppressed rules and the total number of tasks. Click on an author link to view their task details.
- The Checked Files (Details) section lists all the files that were checked. For each file, it shows the total number of tasks and the number of suppressed tasks. If a task was reported for a file, the task details are displayed, including the name (ID) of the static analysis rule that was violated, the rule message, and the line number.
Test Generation Section
An overview of test generation results for the tested project(s). It shows the number of checked files, generated test files, and new test cases, as well as the total test case generation time.

Test Execution Section
- The first section is an overview of all test execution results for the tested project(s). It shows the he number of tasks that need to be addressed, the execution results (passed, failed, and total test cases), as well as the total execution time. Note that unverified outcomes are counted as passed test cases.
- The All Tasks section displays the details of tasks organized by category.
- The Coverage section shows basic test coverage statistics. You can expand the nodes to see the number of executable lines covered per file.
- The Tasks by Author section includes a table of authors associated with the executed tests, which shows the total number of tasks per each author. Click on an author link to view their task details.

| Anchor | ||||
|---|---|---|---|---|
|
...
- A header that shows the name of the test configuration used for the C/C++test run and the times stamp of the run.
- A summary that shows the total number of tasks and details of tasks.

| Anchor | ||||
|---|---|---|---|---|
|
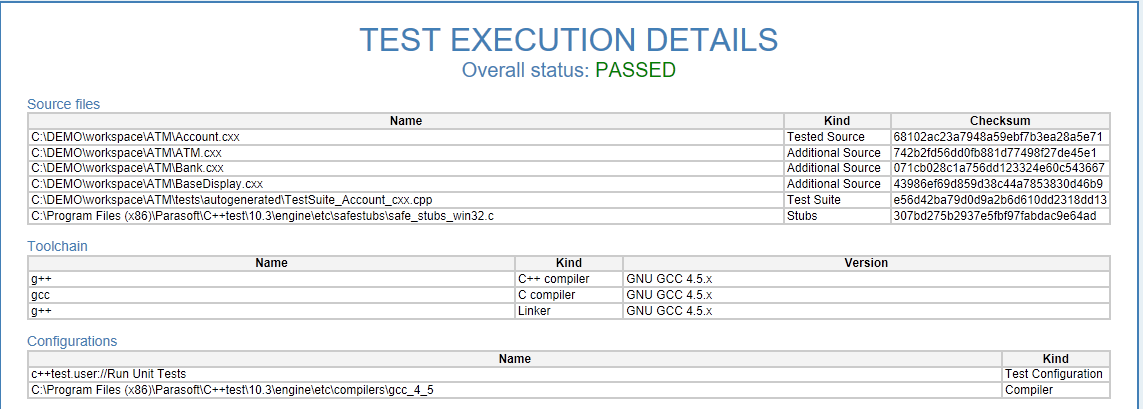
You can generate an additional Test Execution Details report linked to your regular report. Click Generate Report after the test completes (see Generating the Report). The link to the Test Execution Details report will be available in the Test Execution Details column included in the Additional Reports section at the bottom of main report.


| Info |
|---|
The HTML report uses relative link paths that will remain intact if you move the reports to another location. |
...
tested files
the toolchain used for building test harnesses
additional configuration files
test suites
test cases (including Test Case Definition and Test Case Execution Log sections)



See Generating Reports for information how to enable generating the Test Execution Details report.