...
Click on a row in the widget to open the Test Explorer filtered according to the type of status change for the selected builds. If you click on the # Pass→Fail or # Fail→Pass status change link, the ability to limit the results will be disabled in the Test Explorer. Also see Using the Search Panel.
Custom Dashboard Properties
...
| Anchor | ||||
|---|---|---|---|---|
|
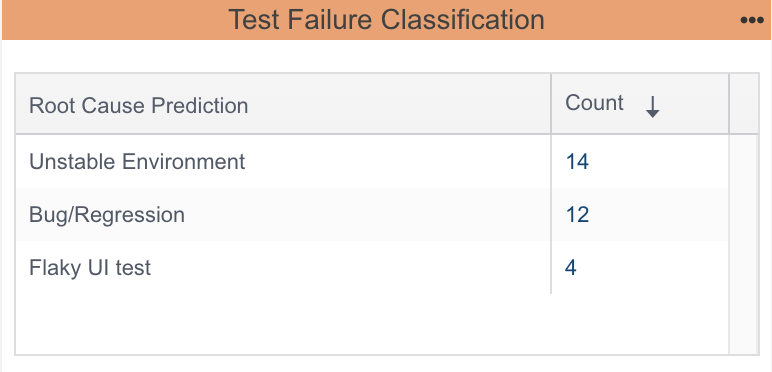
This widget shows presents the predicted root cause and occurrence count across frequency of all failed tests, as determined by the failure classification model. It provides a quick overview of why tests may have failed and should be used in conjunction with the Test Failure Classification Statistics widget for detailed analysis.
Note: A root cause prediction Outlier refers to a type of failure that has not been observed before.
| Excerpt Include+ | ||||
|---|---|---|---|---|
|
...
This widget shows the number of times a label has been associated with a test failure message for the specified filter. It is particularly useful when your team is getting started with Test Failures Classification. In order to make predictions, the model requires that at least two test failure labels are associated with five or more test failure messages.
| Excerptexcerpt-includeplus | ||||
|---|---|---|---|---|
|
...
| Title | Enter a new title to replace the default title that appears on the dashboard. |
|---|---|
| Filter | Choose Dashboard Settings to use the dashboard filter or choose a filter from the menu. |
Actions
Click on the count to drilldown to the Test Failure Classification Diagnostics Report.
Custom Dashboard Properties
...
| Anchor | ||||
|---|---|---|---|---|
|

This widget shows displays the number of files with containing failed tests, total failed tests, labeled tests, and the confidence factor. The count of failed files indicates how concentrated the failures are within specific files. Comparing the total failed tests to labeled tests helps you identify how many failures are new, assuming previously failing tests have already been labeled. The confidence factor is the aggregate of the confidence factor of individual root cause predictions.
| Excerpt Include+ | ||||
|---|---|---|---|---|
|
...
| Title | Enter a new title to replace the default title that appears on the dashboard. |
|---|---|
| Filter | Choose Dashboard Settings to use the dashboard filter or choose a filter from the menu. |
| Target Build | Choose a build from the menu to serve as the current data for comparison. |
Actions
Click on any row of the widget to drilldown to the Test Failure Classification Report.
...
| Title | Enter a new title to replace the default title that appears on the dashboard. |
|---|---|
| Filter | Choose Dashboard Settings to use the dashboard filter or choose a filter from the menu. |
| Target Build | Choose a build from the menu to serve as the current data for comparison. |
| Analysis Type | Choose an option from the menu to show all tests, functional tests, unit tests, or manual tests. You can also choose Other to view non-standard tests, such as functional/manual test hybrids. |
| Sort by | Choose an option from the menu to specify how the files should be sorted in the table. Default is Total. |
Actions
- Click on a link in the File Name column to open the file in the Test Explorer.
- Click on the more... link to open the Test Files report, which shows all test files for the build/filter.
...
| Title | Enter a new title to replace the default title that appears on the dashboard. |
|---|---|
| Portfolio | Choose the name of the portfolio from the menu. See Configuring Portfolios for additional information. |
| Build | Enter a build ID to use across all filters. If no build ID is specified, the latest build is used by default. Refer to Build Administration for additional information about build IDs. |
| Show Build Column | Choose Yes from the menu to include the Build column in the widget. The Build column shows the build ID specified in the Build field. Choose No to hide the Build column. If the Build column is not included, you can view the build ID by hovering your pointer over a filter in the Filter column. Refer to Build Administration for additional information about build IDs. |
| Test Environment | Choose a test environment from the menu to constrain the test results to a specific environment. This value is specified during the test execution with the You can also choose All (default) to view test statistics for all environments associated with the build. |
| Width | The DTP dashboard is a six-column wide grid that can have an unlimited number of rows. Specify how many columns the widget should span. Default is Also seeAbout the Dashboard Grid. |
| Height | The DTP dashboard is a six-column wide grid that can have an unlimited number of rows. Specify how many rows the widget should span. Default is Also seeAbout the Dashboard Grid. |
Actions
Click on a link to open the Violations Explorer view filtered by severity and project filter.
...