...
| Code Block |
|---|
"name": "metrics",
"type": "native",
"uuid": "b59078d3-1328-4bbf-a853-bb2b754f3ce0" |
Metrics -
...
Table
 Image Added
 Image Removed
This widget shows the ten modules with the highest a table of aggregation values for a metric average, min, max, and sum of five metrics for the specified build. The module with the highest value appears in the largest tile and has the deepest color. The smallest, lightest colored tile has the lowest aggregation value.
Widget Configuration
| Title | Enter a new title to replace the default title that appears on the dashboard. |
|---|
| Filter | Choose Dashboard Settings to use the dashboard filter or choose a filter from the menu. |
|---|
| Target Build | Choose Dashboard Settings or a specific build from the menu. If you choose Dashboard Settings, the target build will be inherited from the dashboard (see Configuring Dashboard Settings). |
|---|
| Metric (1-5) | Choose a metric from each menu to add the metric to the table |
|---|
.Aggregation | Choose the aggregation value type from the menuActions
Mouse over a tile to view the full module name and actual aggregation value.
Click on a tile value in the table to open the metrics explorer view filtered by the module. See Metrics ExplorerSingle Metric Overview report for that metric. See Single Metric Overview Report.
Click the more... link to open the Single Metric Metrics Overview report. See Single Metric See Metrics Overview Report.
Custom Dashboard Properties
...
| Code Block |
|---|
"name": "metrics",
"type": "native",
"uuid": "d3a8871008d38db4-9886751d-46bb406a-bbbe9468-9802bdb10494414afebee1f4" |
Metrics -
...
Tree Map
| Anchor |
|---|
| MetricsTreeMap |
|---|
| MetricsTreeMap |
|---|
|
Image AddedImage Removed
This widget shows a table of the ten modules with the highest aggregation values for average, min, max, and sum of five metrics a metric for the specified build. The module with the highest value appears in the largest tile and has the deepest color. The smallest, lightest colored tile has the lowest aggregation value.
Widget Configuration
| Title | Enter a new title to replace the default title that appears on the dashboard. |
|---|
| Filter | Choose Dashboard Settings to use the dashboard filter or choose a filter from the menu. |
|---|
| Target Build | Choose Dashboard Settings or a specific build from the menu. If you choose Dashboard Settings, the target build will be inherited from the dashboard (see Configuring Dashboard Settings). |
|---|
| Metric |
|---|
(1-5) | Choose a metric from each menu to add the metric to the table. |
|---|
| Aggregation | Choose the aggregation value type from the menu. |
|---|
Actions
Mouse over a tile to view the full module name and actual aggregation value.
Click on a value in the table tile to open the Single Metric Overview report for that metric. See Single Metric Overview Reportmetrics explorer view filtered by the module. See Metrics Explorer.
Click the more... link to open the Metrics Single Metric Overview report. See Metrics See Single Metric Overview Report.
Custom Dashboard Properties
...
| Code Block |
|---|
"name": "metrics",
"type": "native",
"uuid": "08d38db4d3a88710-751d9886-406a46bb-9468bbbe-414afebee1f49802bdb10494" |
Metrics - Trend
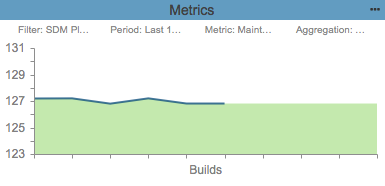
This widget shows the change in metric value from build to build over the specified period. It includes a shaded area and a line to represent the data. Gaps in the line represent builds within the selected period that do not have metric information. Also see Using Build Administration for information about data within a build.
...
| Code Block |
|---|
"name": "metrics",
"type": "native",
"uuid": "78fc326e-bbb8-4e19-b7f5-942f32da6298" |
Resource Groups -
...
Table
| Anchor |
|---|
| ResourceGroupsTable |
|---|
| ResourceGroupsTable |
|---|
|
 Image Added
 Image Removed
This widget shows up to ten the five resource groups with the highest aggregate values for the selected metric. Larger, darker tiles have a higher metric value. See See Associating Resource Groups with Filters for information about resource groups.
...
| Title | Enter a new title to replace the default title that appears on the dashboard. |
|---|
| Filter | Choose Dashboard Settings to use the dashboard filter or choose a filter from the menu. |
|---|
| Target Build | Choose Dashboard Settings or a specific build from the menu. If you choose Dashboard Settings, the target build will be inherited from the dashboard (see Configuring Dashboard Settings). |
|---|
| Metric | Choose a metric from each menu to add the metric to the table. |
|---|
Aggregation the value from the menu| by which the data in the widget should be sorted. |
Actions
Mouse over a tile to view the metric value in a tool tip.
Click on a tile to view the resource group in the Click on a resource group in the in the Name column to view it in the Metrics Explorer.
Click on the the ...more link link to open the the Resource Groups Report.
Custom Dashboard Properties
You can add this widget to your custom dashboards by specifying the following properties in the dashboard definition JSON file (see Custom Dashboard Templates for details):
| Code Block |
|---|
"name": "Resource_Groupsmetrics_by_res_groups_top_5",
"type": "native",
"iduuid": "ed159a1a72c1b60d-ceb869cd-11e74651-abc491df-cec278b6b50a8b78a9265720", |
Resource Groups -
...
Tree Map
| Anchor |
|---|
| ResourceGroupsTreeMap |
|---|
| ResourceGroupsTreeMap |
|---|
|
Image AddedImage Removed
This widget shows the five up to ten resource groups with the highest aggregate values for the selected metric. Larger, darker tiles have a higher metric value. See See Associating Resource Groups with Filters for information about resource groups.
...
| Title | Enter a new title to replace the default title that appears on the dashboard. |
|---|
| Filter | Choose Dashboard Settings to use the dashboard filter or choose a filter from the menu. |
|---|
| Target Build | Choose Dashboard Settings or a specific build from the menu. If you choose Dashboard Settings, the target build will be inherited from the dashboard (see Configuring Dashboard Settings). |
|---|
| Metric | Choose a metric from each menu to add the metric to the table. |
|---|
Sort by an | the aggregation value type |
by which the data in the widget should be sortedActions
Mouse over a tile to view the metric value in a tool tip.
Click on a tile to view the resource group in the in the Name column to view it in the the Metrics Explorer.
Click on the the ...more link link to open the the Resource Groups Report.
Custom Dashboard Properties
You can add this widget to your custom dashboards by specifying the following properties in the dashboard definition JSON file (see Custom Dashboard Templates for details):
| Code Block |
|---|
"name": "metrics_by_res_groups_top_5Resource_Groups",
"type": "native",
"uuidid": "72c1b60ded159a1a-69cdceb8-465111e7-91dfabc4-8b78a9265720cec278b6b50a", |