Adding SNMP Agent MonitorsLoad Test can retrieve data based on the provided OID(s) from the SNMP agents of versions 1 and 2c. To add an SNMP agent monitor: - Right-click the Monitors node in the Load Test tab and choose New Monitors from the shortcut menu. A New Monitors dialog displays.
- Select SNMP from the New Monitors dialog, then click Finish. A configuration panel for the new monitor will open in the right panel.
- Type the SNMP agent’s host name in the Host field.
- Type the SNMP agent’s community in the Community field.
- Enter a parameter by clicking New. The New Parameter dialog opens.
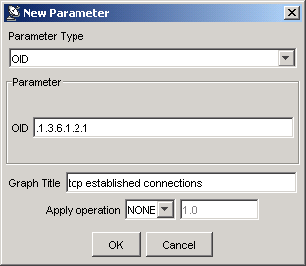
- Complete the New Parameter dialog as follows:
- Parameter Type: Select OID or Composite.
- Parameter: Depending on the Parameter Type selected, the Parameter options will vary according to the following:
- OID: Enter the Object ID that identifies a specific parameter within the SNMP agent community. (Only available if OID is selected in the Parameter Type drop-down menu).
- Composite: Select Processor, Memory, Network, or TCP to collect corresponding data.
- Counters: Depending on the selection from the Composite parameter drop-down menu, displays CPU Utilization (%), Memory Utilization (%), and Network Utilization (%); these counters are calculated by querying a set of OIDs.
If TCP is selected from the Composite parameter drop-down menu, you must select a counter from the Counters box. - Parameter Explanation: Displays an explanation for the Composite parameter selected.
- Graph Title: Enter a title for the graph that will correspond to the Monitor you are adding. This title will display in Load Test Progress graphs, and in Detailed Report graphs.
- Apply operation: Select to apply simple operations to values returned by an SNMP agent. Use "*" for "multiply", "/" for "divide", and "%" for "percentage of". For example, if the agent returns the value of the allocated memory in bytes but you want to see it in KB, you would apply a "/ 1024" operation by selecting "/" from the drop-down menu and entering "1024" in the adjacent text field. You could then add "Memory in kilobytes" into the Graph Title field.
- Repeat the above step until the Parameters table shows all parameters you want this SNMP agent to monitor.
- Verify the new monitor by right-clicking the related node in the Load Tests tree’s Monitors> SNMP branch.
To add a Windows performance monitor (functionality which is only available if you have a Windows installation of Load Test): - Right-click the Load Test tab’s Monitors node, then choose New Monitors from the shortcut menu. A New Monitors dialog displays.
- Select Windows from the New Monitors dialog, then click Finish.
- Type the perfmon’s host name in the Host field.
- Enter a parameter by clicking New. The Add performance counter dialog opens.
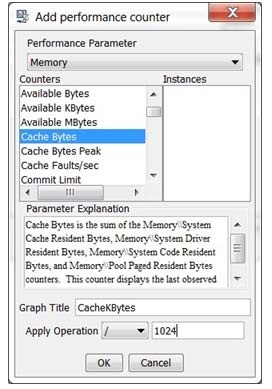
- Complete the New Parameter dialog as follows:
- Select the performance counter and instance of the parameter you want to monitor. An explanation of the parameter you select displays in the Parameter Explanation box.
- In the Graph Title field, enter a title for the graph that will correspond to the Monitor you are adding. This title will display in Load Test Progress graphs, and in Detailed Report graphs.
- In the Apply Operation sub-panel, select an operation and a value to be applied to the monitor data if needed. For example, by selecting the / (divide) operation and entering
1024 in the operation value field, you could convert the original monitor value from Bytes to KBytes.
- Repeat the above step until the Parameters table shows all parameters you want this perfmon to monitor.
- Verify the new monitor by right-clicking the related node in the Load Tests tree’s Monitors> Windows branch.
Adding WebSphere MonitorsBefore adding a WebSphere monitor, go to the Security> Global security section of the WebSphere Administrative console and ensure that the Enable administrative security check box is unselected. To add a WebSphere monitor: - Right-click the Load Test tab’s Monitors node, then choose New Monitors from the shortcut menu. A New Monitors dialog displays.
- Select WebSphere from the New Monitors dialog, then click Finish.
- In the Project Configuration panel, click Configure. A Configure WebSphere Agent dialog displays.
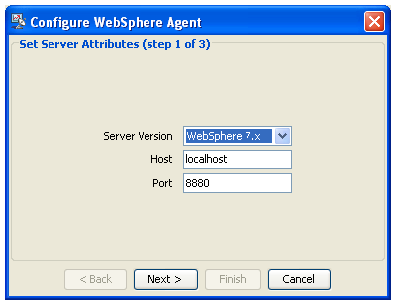
- Enter the Host name, change the Port number if necessary, then click Next.
- In the Configure WebSphere Agent panel, enter or browse to the appropriate Path of the WebSphere installation. For example: C:\IBM\WebSphere.
- Click Next. The Configure WebSphere Agent dialog displays a table of the required Jar files for the server and indicates whether or not the appropriate Jar files were found.
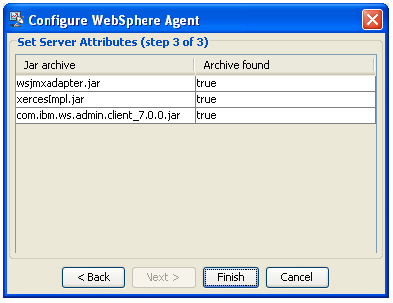
- In the Configure WebSphere Agent dialog, click Finish. The Add Parameter dialog opens.
- Select a Parameter from the left GUI panel of the Add Parameter dialog. The Name, Description, and Value for each instance of the parameter you want to monitor displays in the right GUI panel of the Add Parameter dialog.
- In Select column from the right GUI panel, check the parameter instances that you want to monitor, then click OK. The parameters you choose will display in Load Test Progress graphs, and in Detailed Report graphs.
Adding WebLogic MonitorsTo add a WebLogic Monitor: - Right-click the Load Test tab’s Monitors node, then choose New Monitors from the shortcut menu. A New Monitors dialog displays.
- Select WebLogic from the New Monitors dialog, then click Finish.
In the Project Configuration panel, click Configure. A Configure WebLogic Agent dialog displays.
 Image Removed Image Removed| Note |
|---|
| For WebLogic 8.1 SP6 and WebLogic 9.x monitors, Load Test needs to be started with the -Dsun.lang.ClassLoader.allowArraySyntax=true option. To do that in the command prompt, navigate to the Load Test installation directory and run the following command: lt -Dsun.lang.ClassLoader.allowArraySyntax=true
 Image Removed Image Removed
- Enter the Host name, change the Port number if necessary, then click the Next.
- In the Configure WebLogic Agent panel, enter or browse to the appropriate Path of the desired WebLogic implementation on your machine. For example: C:\Oracle\Middleware\wlserver_10.3.
- Click Next. The Configure WebLogic Agent dialog displays a table of the required Jar files for the server and indicates whether or not the appropriate Jar files were found.
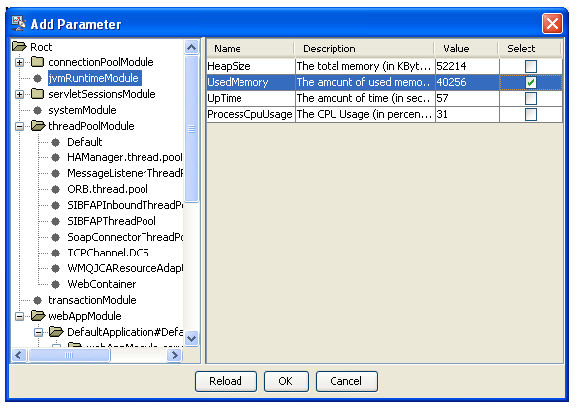
- In the Configure WebLogic Agent dialog, click Finish. The Add Parameter dialog opens.
 Image Removed Image Removed
- Select a Parameter from the left GUI panel of the Add Parameter dialog. The Name, Description, and Value for each instance of the parameter you want to monitor displays in the right GUI panel of the Add Parameter dialog.
- In Select column from the right GUI panel, check the parameter instances that you want to monitor, then click OK. The parameters you choose will display in Load Test Progress graphs, and in Detailed Report graphs.
Adding JBoss MonitorsTo add a JBoss monitor: - Right-click the Load Test tab’s Monitors node, then choose New Monitors from the shortcut menu. A New Monitors dialog displays.
- Select JBoss from the New Monitors dialog, then click Finish.
- In the Project Configuration panel, click Configure. A Configure JBoss Agent dialog displays.
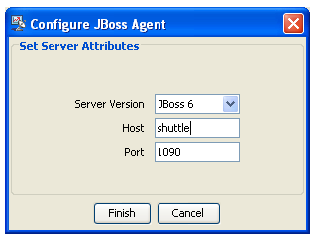 - In the Configure JBoss Agent dialog, enter host name, change port number if necessary, then click Finish. The Add Parameter dialog opens.
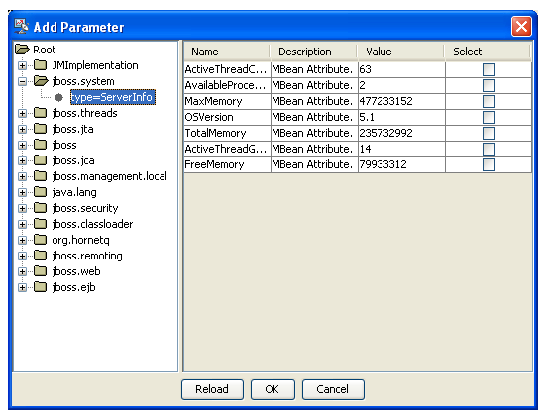
- Select a Parameter from the left GUI panel of the Add Parameter dialog. The Name, Description, and Value for each instance of the parameter you want to monitor displays in the right GUI panel of the Add Parameter dialog.
- In Select column from the right GUI panel, check the parameter instances that you want to monitor, then click OK. The parameters you choose will display in Load Test Progress graphs, and in Detailed Report graphs.
Adding Tomcat Monitors| Info |
|---|
| In order to use this monitor, Tomcat should be started with the following Java system properties: - -Dcom.sun.management.jmxremote
- -Dcom.sun.management.jmxremote.port=7744
- -Dcom.sun.management.jmxremote.ssl=false
- -Dcom.sun.management.jmxremote.authenticate=false
Use the port of your choice with the com.sun.management.jmxremote.port system property. For example, you can add the following Java system properties to the catalina.bat Tomcat launch script if you are on Windows: | No Format |
|---|
set "JAVA_OPTS=%JAVA_OPTS% -Dcom.sun.management.jmxremote -Dcom.sun.management.jmxremote.port=7744 -Dcom.sun.management.jmxremote.ssl=false -Dcom.sun.management.jmxremote.authenticate=false" |
If your Tomcat is installed as a Windows service: - Launch Tomcat9w.exe
- Click the the Java tab in the Apache Tomcat Properties window
- Add the Java system properties to the "Java Options" section. Each Java system property must be on a new line.
|
To add a Tomcat monitor: - Right-click the Load Test tab’s Monitors node, then choose New Monitors from the shortcut menu. A New Monitors dialog displays.
- Select Tomcat from the New Monitors dialog, then click Finish.
- In the Project Configuration panel, click Configure. A Configure Tomcat Agent dialog displays.
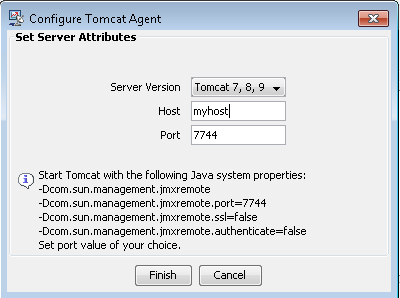
- In the Configure Tomcat Agent dialog, enter the host name, change the port number if necessary, then click Finish The Add Parameter dialog opens.
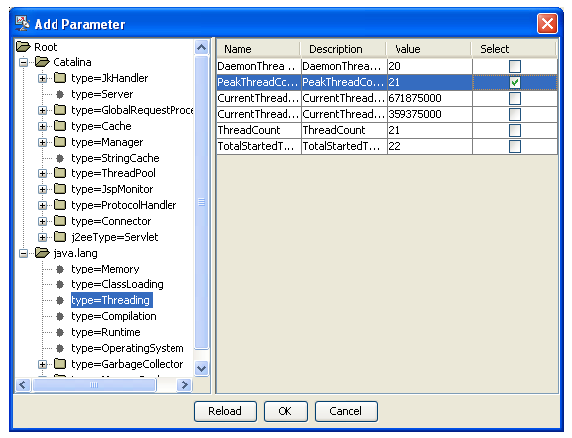
- Select a Parameter from the left GUI panel of the Add Parameter dialog. The Name, Description, and Value for each instance of the parameter you want to monitor displays in the right GUI panel of the Add Parameter dialog.
- In Select column from the right GUI panel, check the parameter instances that you want to monitor, then click OK. The parameters you choose will display in Load Test Progress graphs, and in Detailed Report graphs.
Adding rstat MonitorsTo add an rstat monitor: - Right-click the Load Test tab’s Monitors node, then choose New Monitors from the shortcut menu. A New Monitors dialog displays.
- Select rstat from the New Monitors dialog, then click Finish.
| Note |
|---|
| For rstat monitors to be enabled, copy the djrpc.jar and rstatcl.jar files to the <INSTALL>/plugins/com.parasoft.ptest.libs.web_<VERSION>/root directory and add them to the classpath. Add the rstatcl.jar file to <INSTALL>/plugins/com.parasoft.ptest.libs.web_<VERSION>/root directory upon installation. The djrpc.jar file must be purchased and copied to the <INSTALL>/plugins/com.parasoft.ptest.libs.web_<VERSION>/root directory. |
Adding Remote JVM Monitors| Note |
|---|
| To use this monitor, the JVM should be started with the following Java system properties: -Dcom.sun.management.jmxremote
-Dcom.sun.management.jmxremote.port=7744
-Dcom.sun.management.jmxremote.ssl=false
-Dcom.sun.management.jmxremote.authenticate=false
Use the port of your choice with the com.sun.management.jmxremote.port system property. |
To add a remote JVM Monitor: - Right-click the Load Tests tab and choose Monitors node, then choose New Monitors from the shortcut menu. A New Monitors dialog displays.
- Select Remote JVM from the New Monitors dialog, then click Finish.
- In the Project Configuration panel, click Configure. A Configure Remote JVM Agent dialog displays.
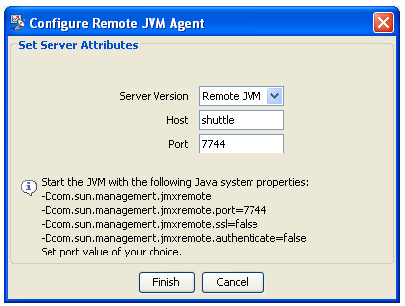
- In the Configure Remote JVM Agent dialog, enter host name and change port number if necessary and press the Finish button. The Add Parameter dialog opens.
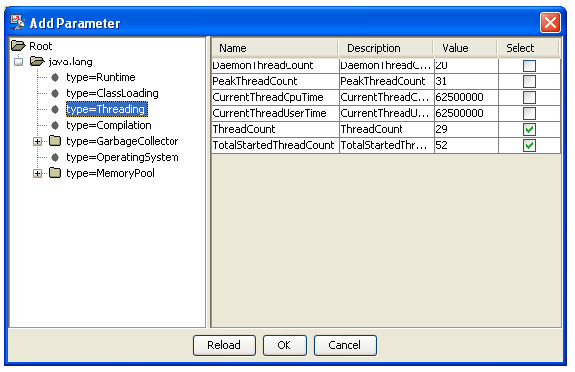
- Select a Parameter from the left GUI panel of the Add Parameter dialog. The Name, Description, and Value for each instance of the parameter you want to monitor displays in the right GUI panel of the Add Parameter dialog.
- In Select column from the right GUI panel, check the parameter instances that you want to monitor, then click OK. The parameters you choose will display in Load Test Progress graphs, and in Detailed Report graphs.
Adding Custom MonitorsCustom monitors can be implemented by JavaScript or Jython scripts, or by Java class methods. This is especially useful if you would like to collect data from sources that are not listed above. | Note |
|---|
| A channel method must return a java.lang.Number type in order to be plotted in Load Test Progress and Detailed Report graphs. |
To add a custom monitor: - Right-click the Load Test tab’s Monitors node, then choose New Monitors from the shortcut menu. A New Monitors dialog displays.
- Select Custom from the New Monitors dialog, then click Finish.
- Enter a name for the Custom monitor in the Name field.
- Click the New button. An Add Channel dialog opens.
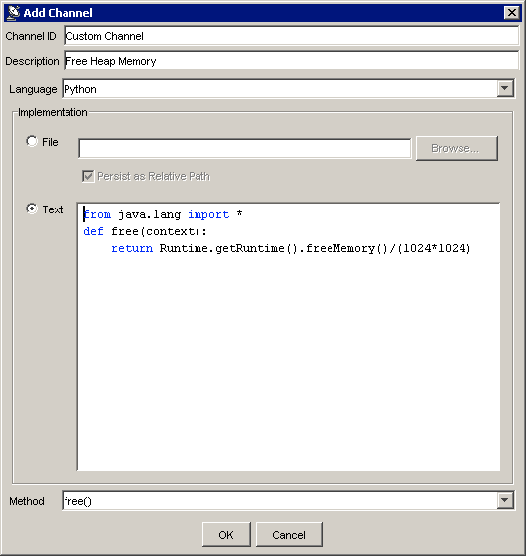
- Enter a name for the channel in the Channel ID field. The name you entered for the Custom Monitor, together with the Channel ID, will comprise the title of the monitor. This title will display in Load Test Progress graphs, and in Detailed Report graphs.
- (Optional) Enter a short description of the channel in the Description field.
- Select a language from the Language menu.
- Specify the script by doing one of the following:
- Select the File radio button and click the Browse button to select the appropriate file.
- Select the Text radio button and enter the script in the text field.
- Specify the method you want invoked from the Method menu.
- Click OK. The new custom channel is added to the Channels table in the right GUI panel.
|