This topic explains how to use Load Test Continuum (LTC), which you can use ( along with the command line interface ) to set up an automated continuous performance testing process and easily monitor its results.In this section:
| Table of Contents | ||
|---|---|---|
|
...
- Eliminate SDLC uncertainty by performing load tests early and in a continuous automated fashion.
- Track performance of services/applications throughout the SDLC, thus discovering and resolving issues before they become a problem.
- Establish a QoS ( Quality of Service (QoS) baseline for performance then and detect deviations from that baseline as soon as they happen.
...
Load Test Continuum organizes test report categories, reports, and report metrics into a tree structure. Report categories can be organized into sub-categories of a desired number of levels. The "." (dot) character in the category path is interpreted as a category/subcategory delimiter.
For example, the string BackComp.SOAtest.Accuracy will be interpreted as a path with "BackComp" as a top-level category, "SOAtest" as the first level sub-category, and "Accuracy" as the second level sub-category. It will be displayed as a three-level tree structure in the Load Test Continuum Project view (see the screen shot in the Project View section below).
...
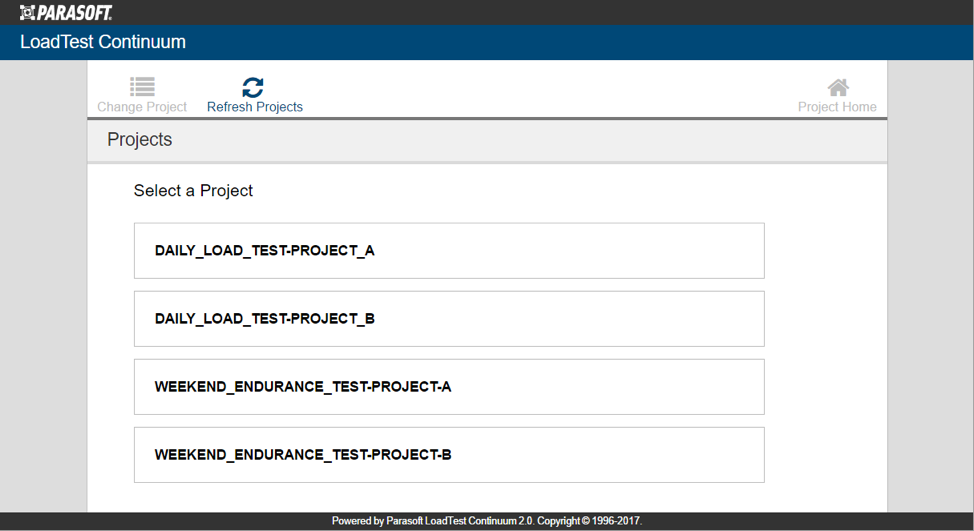
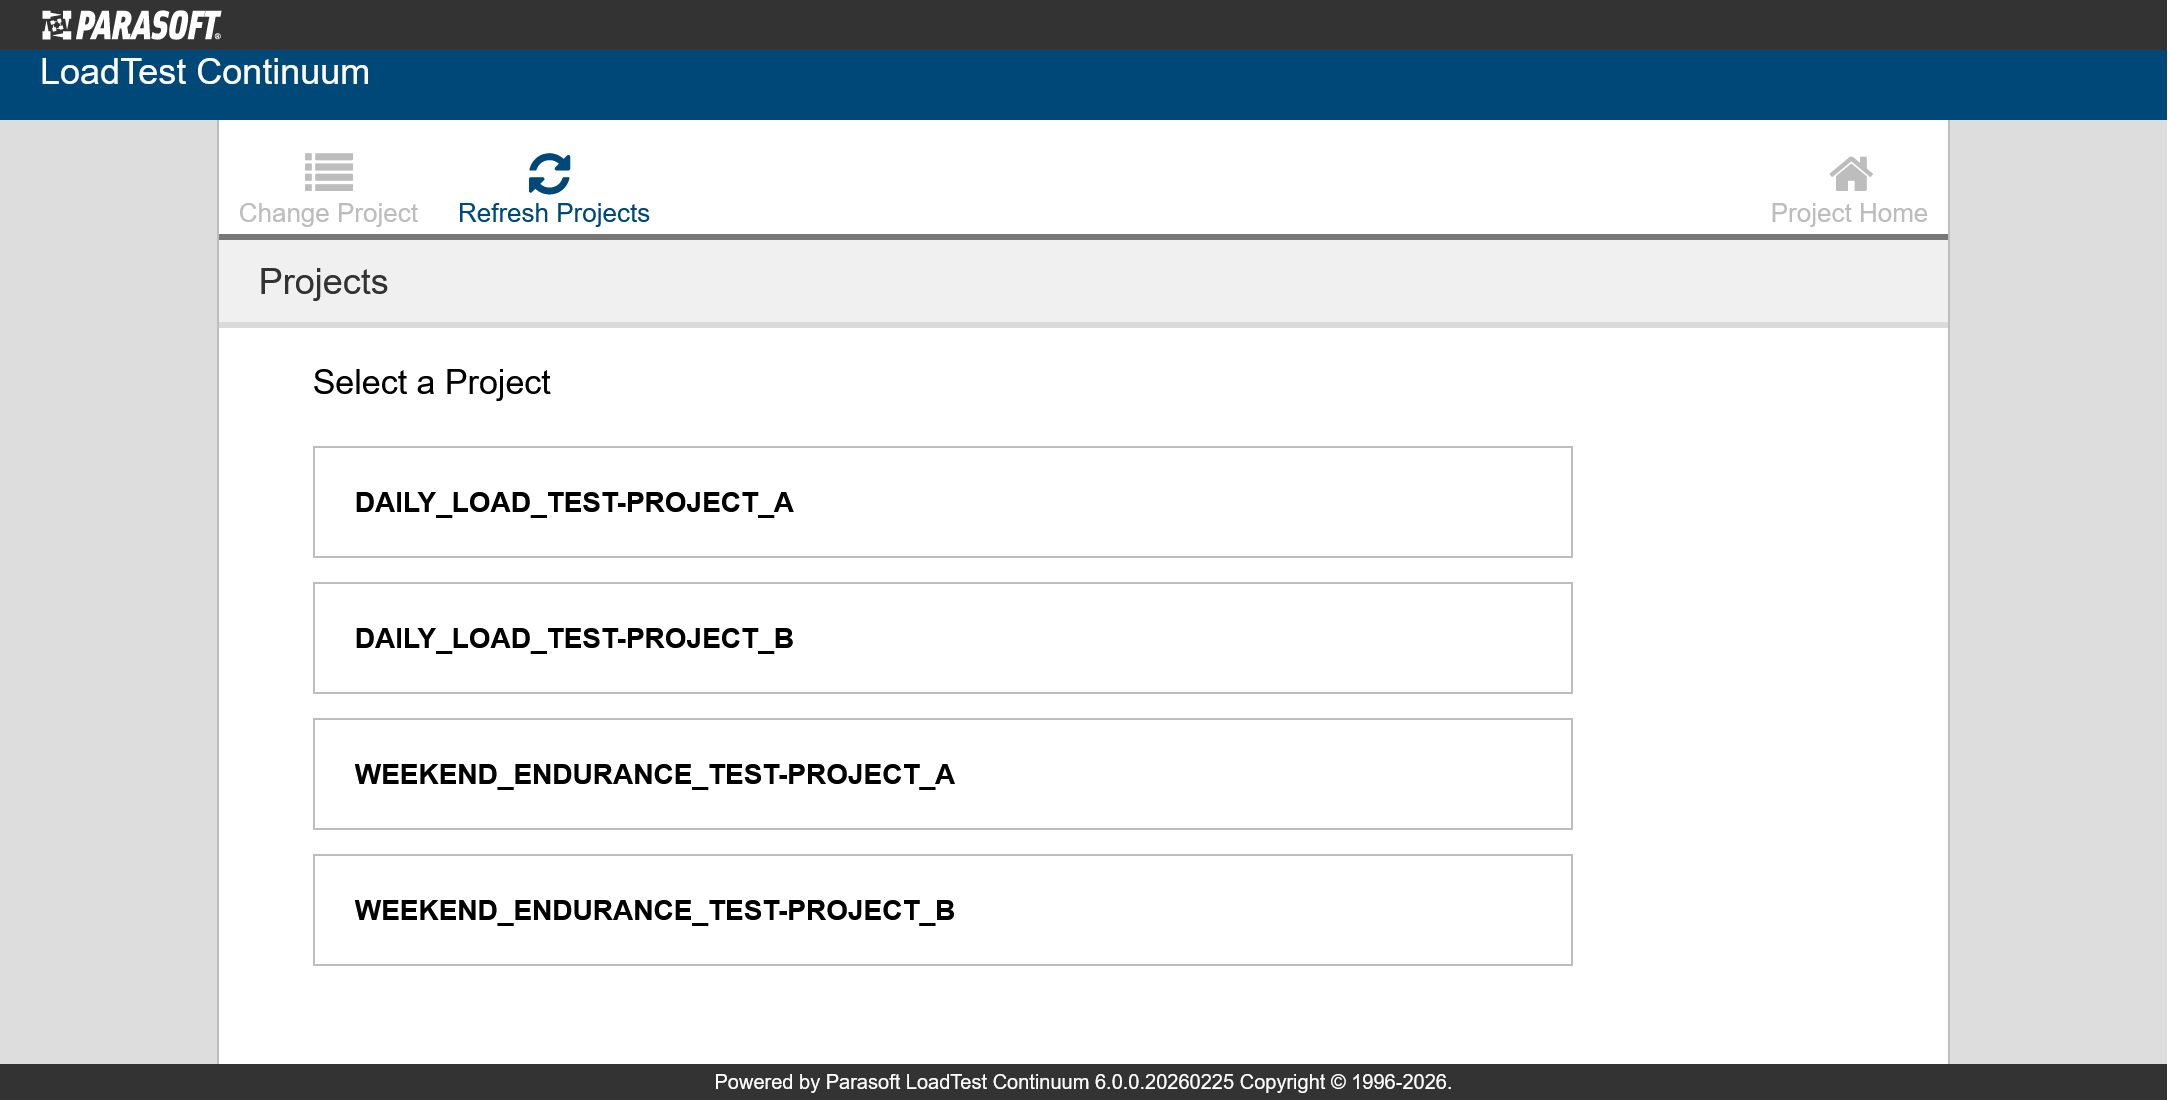
In the project selection view, click the link for the project whose results you want to explore. The appropriate Load Test Continuum project page will open.
Project View
| Anchor | ||||
|---|---|---|---|---|
|
...
To cycle through different months, click the arrows:


To reload report contents, click Reload project data:


Red and green highlights are used to indicate whether a given day’s tests failed or succeeded. You can click a highlighted date to view the Category/Test/Metric tree view for that day.
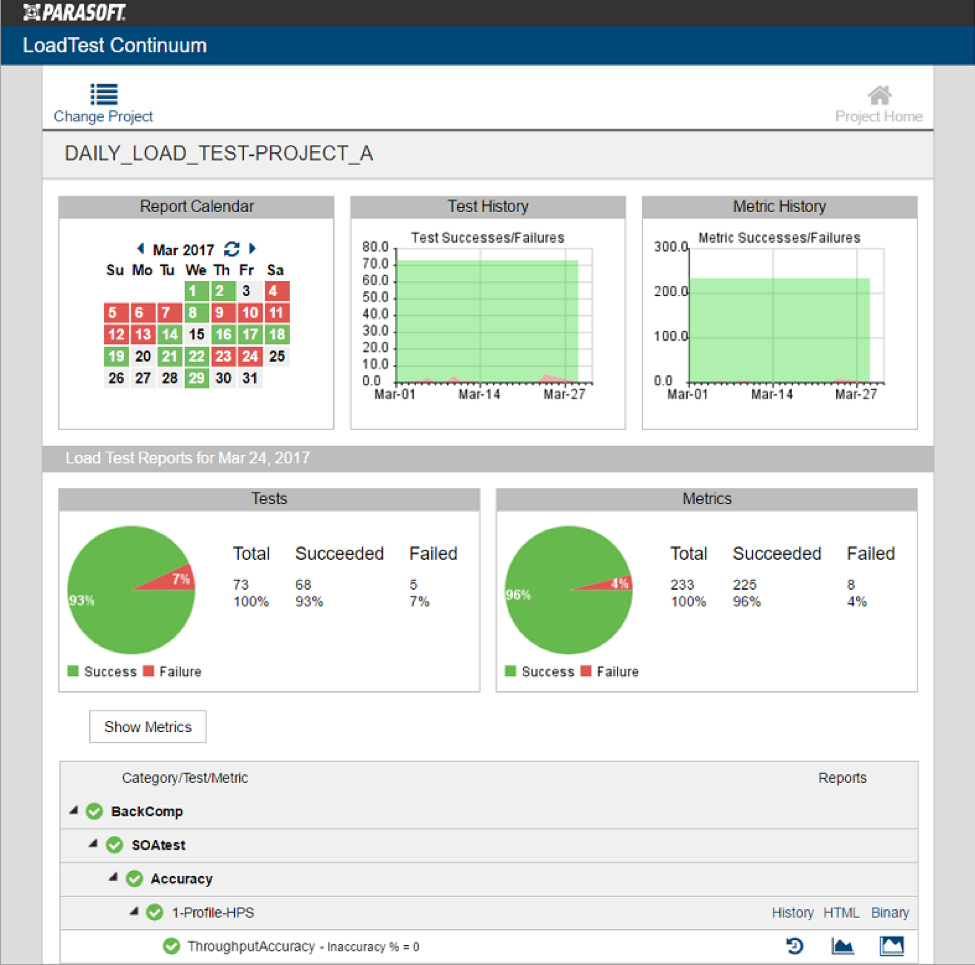
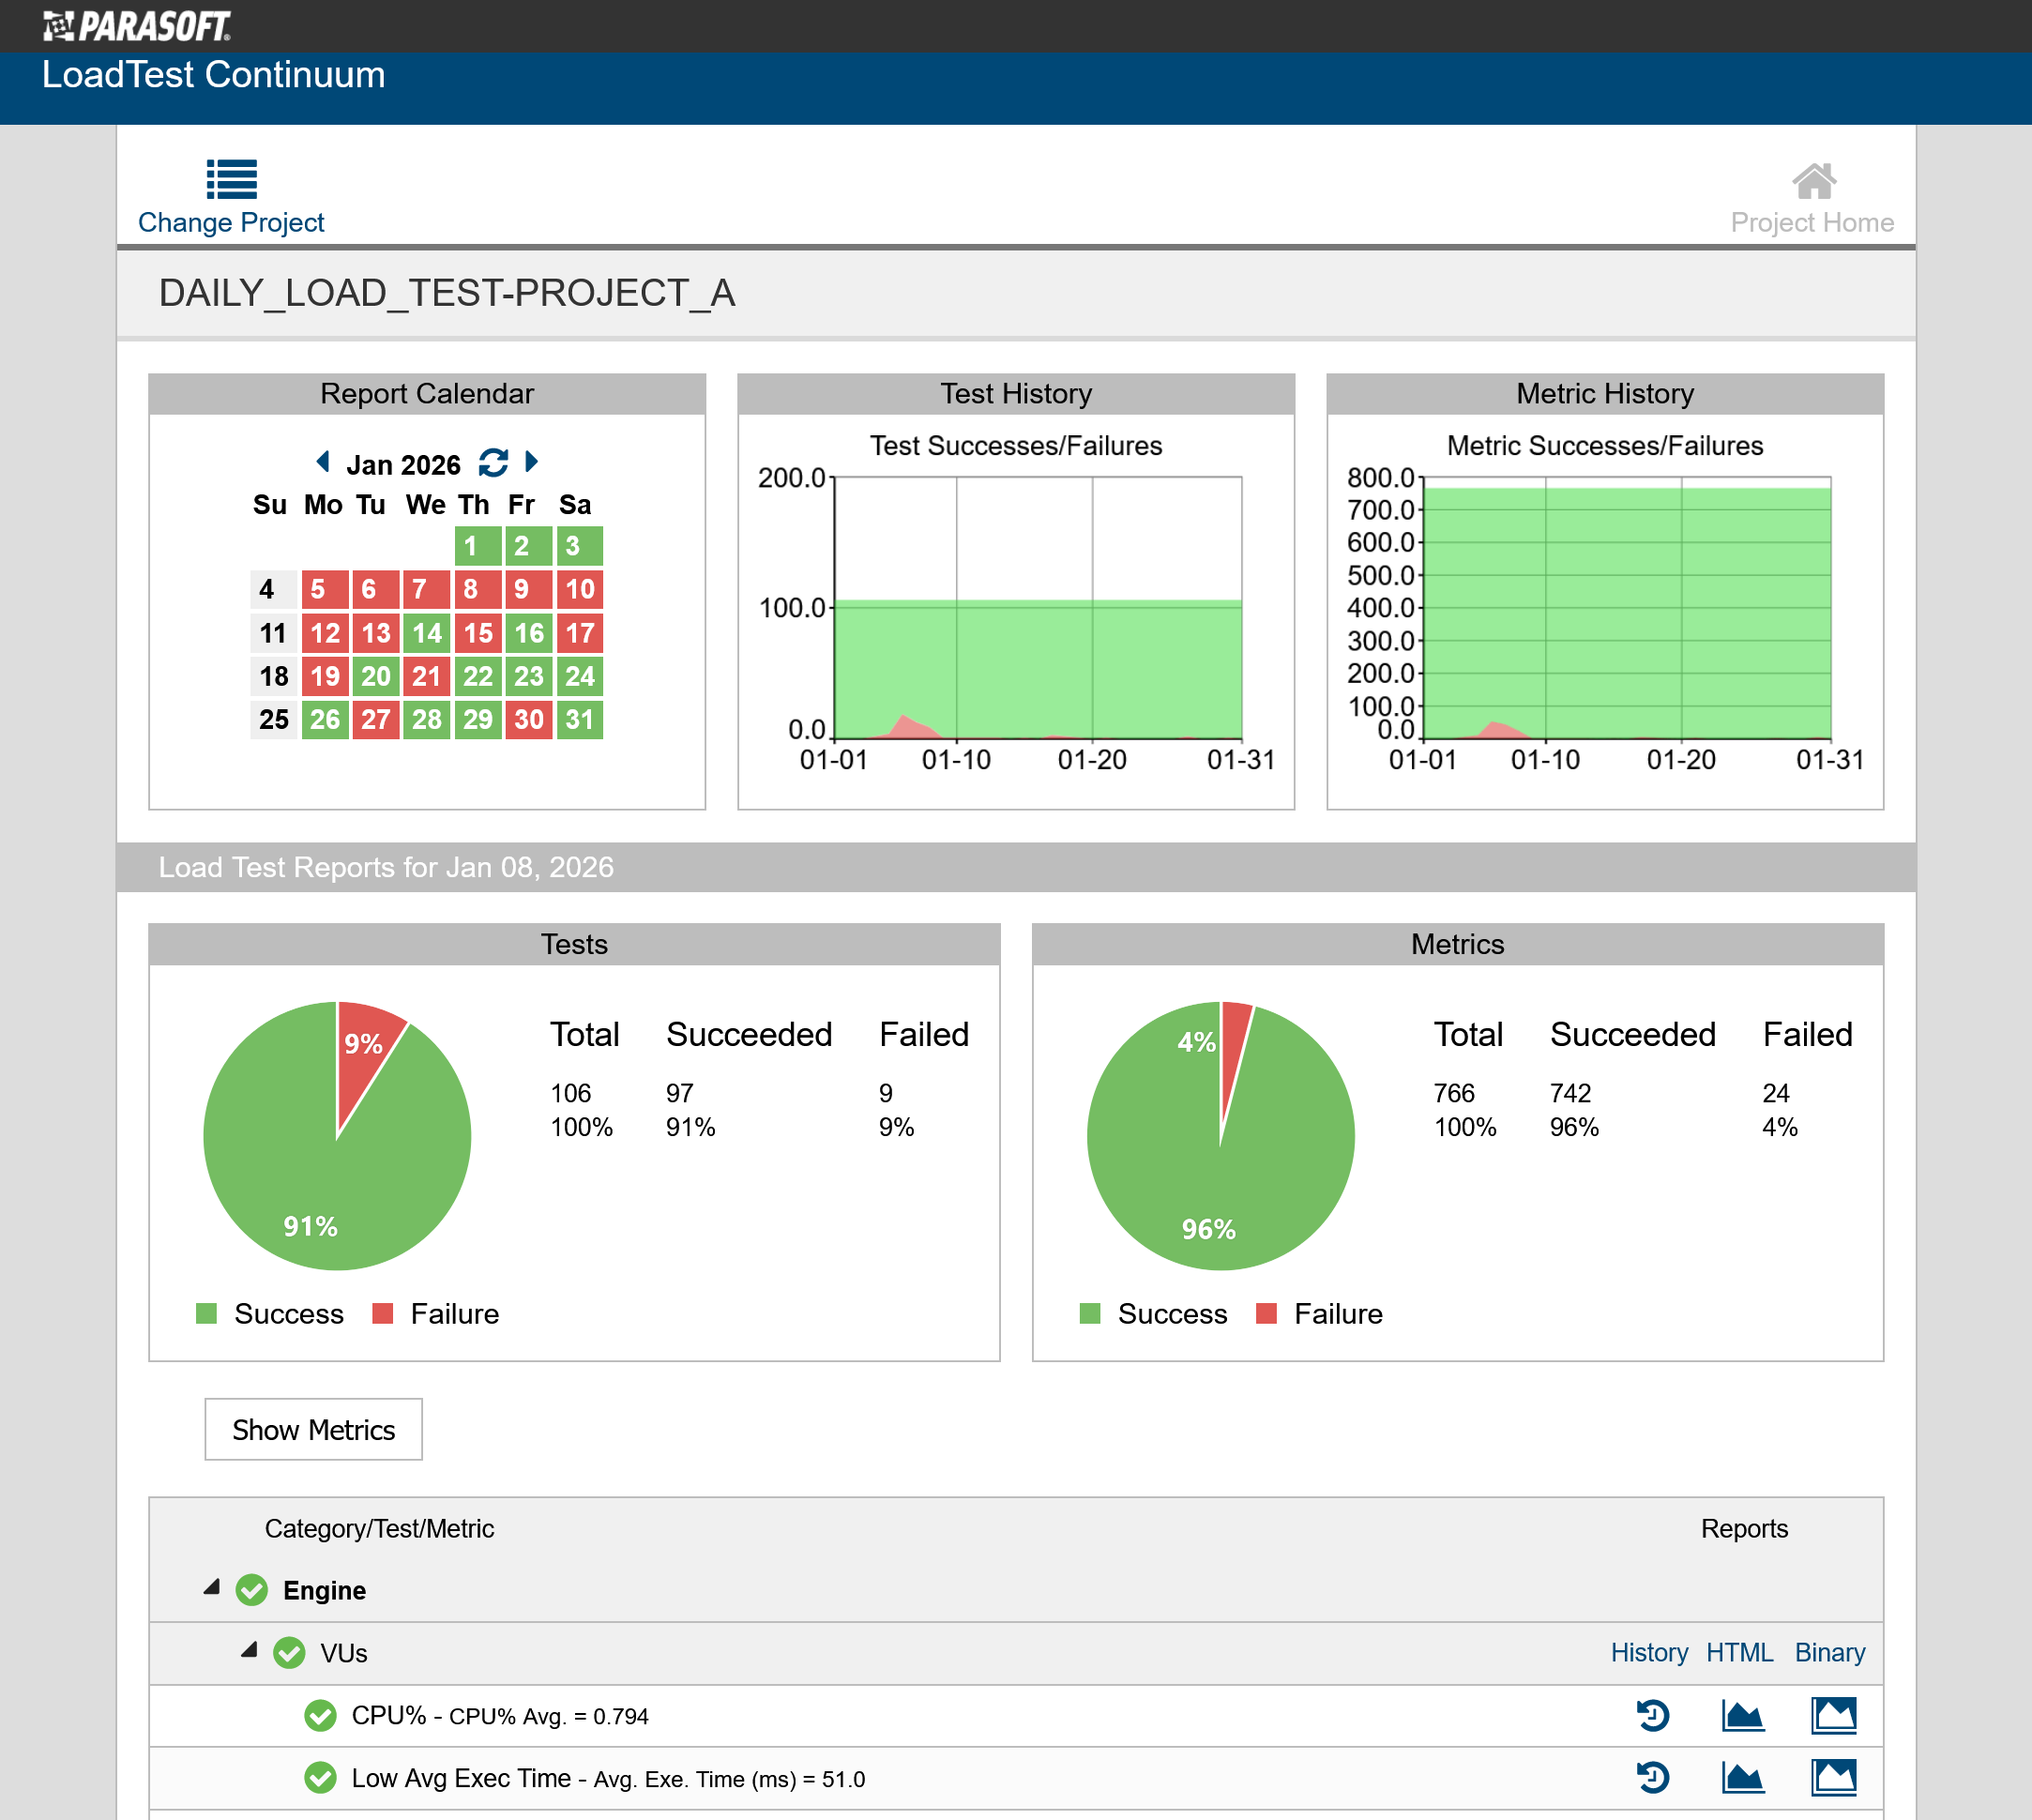
The daily report summary and tree view are displayed under the Project History view. You can click on the disclosure triangle at each node to expand and contract the report tree.
The Load Test report metrics are hidden by default. Click Show Metrics and Hide Metrics to toggle the metrics data open and closed.

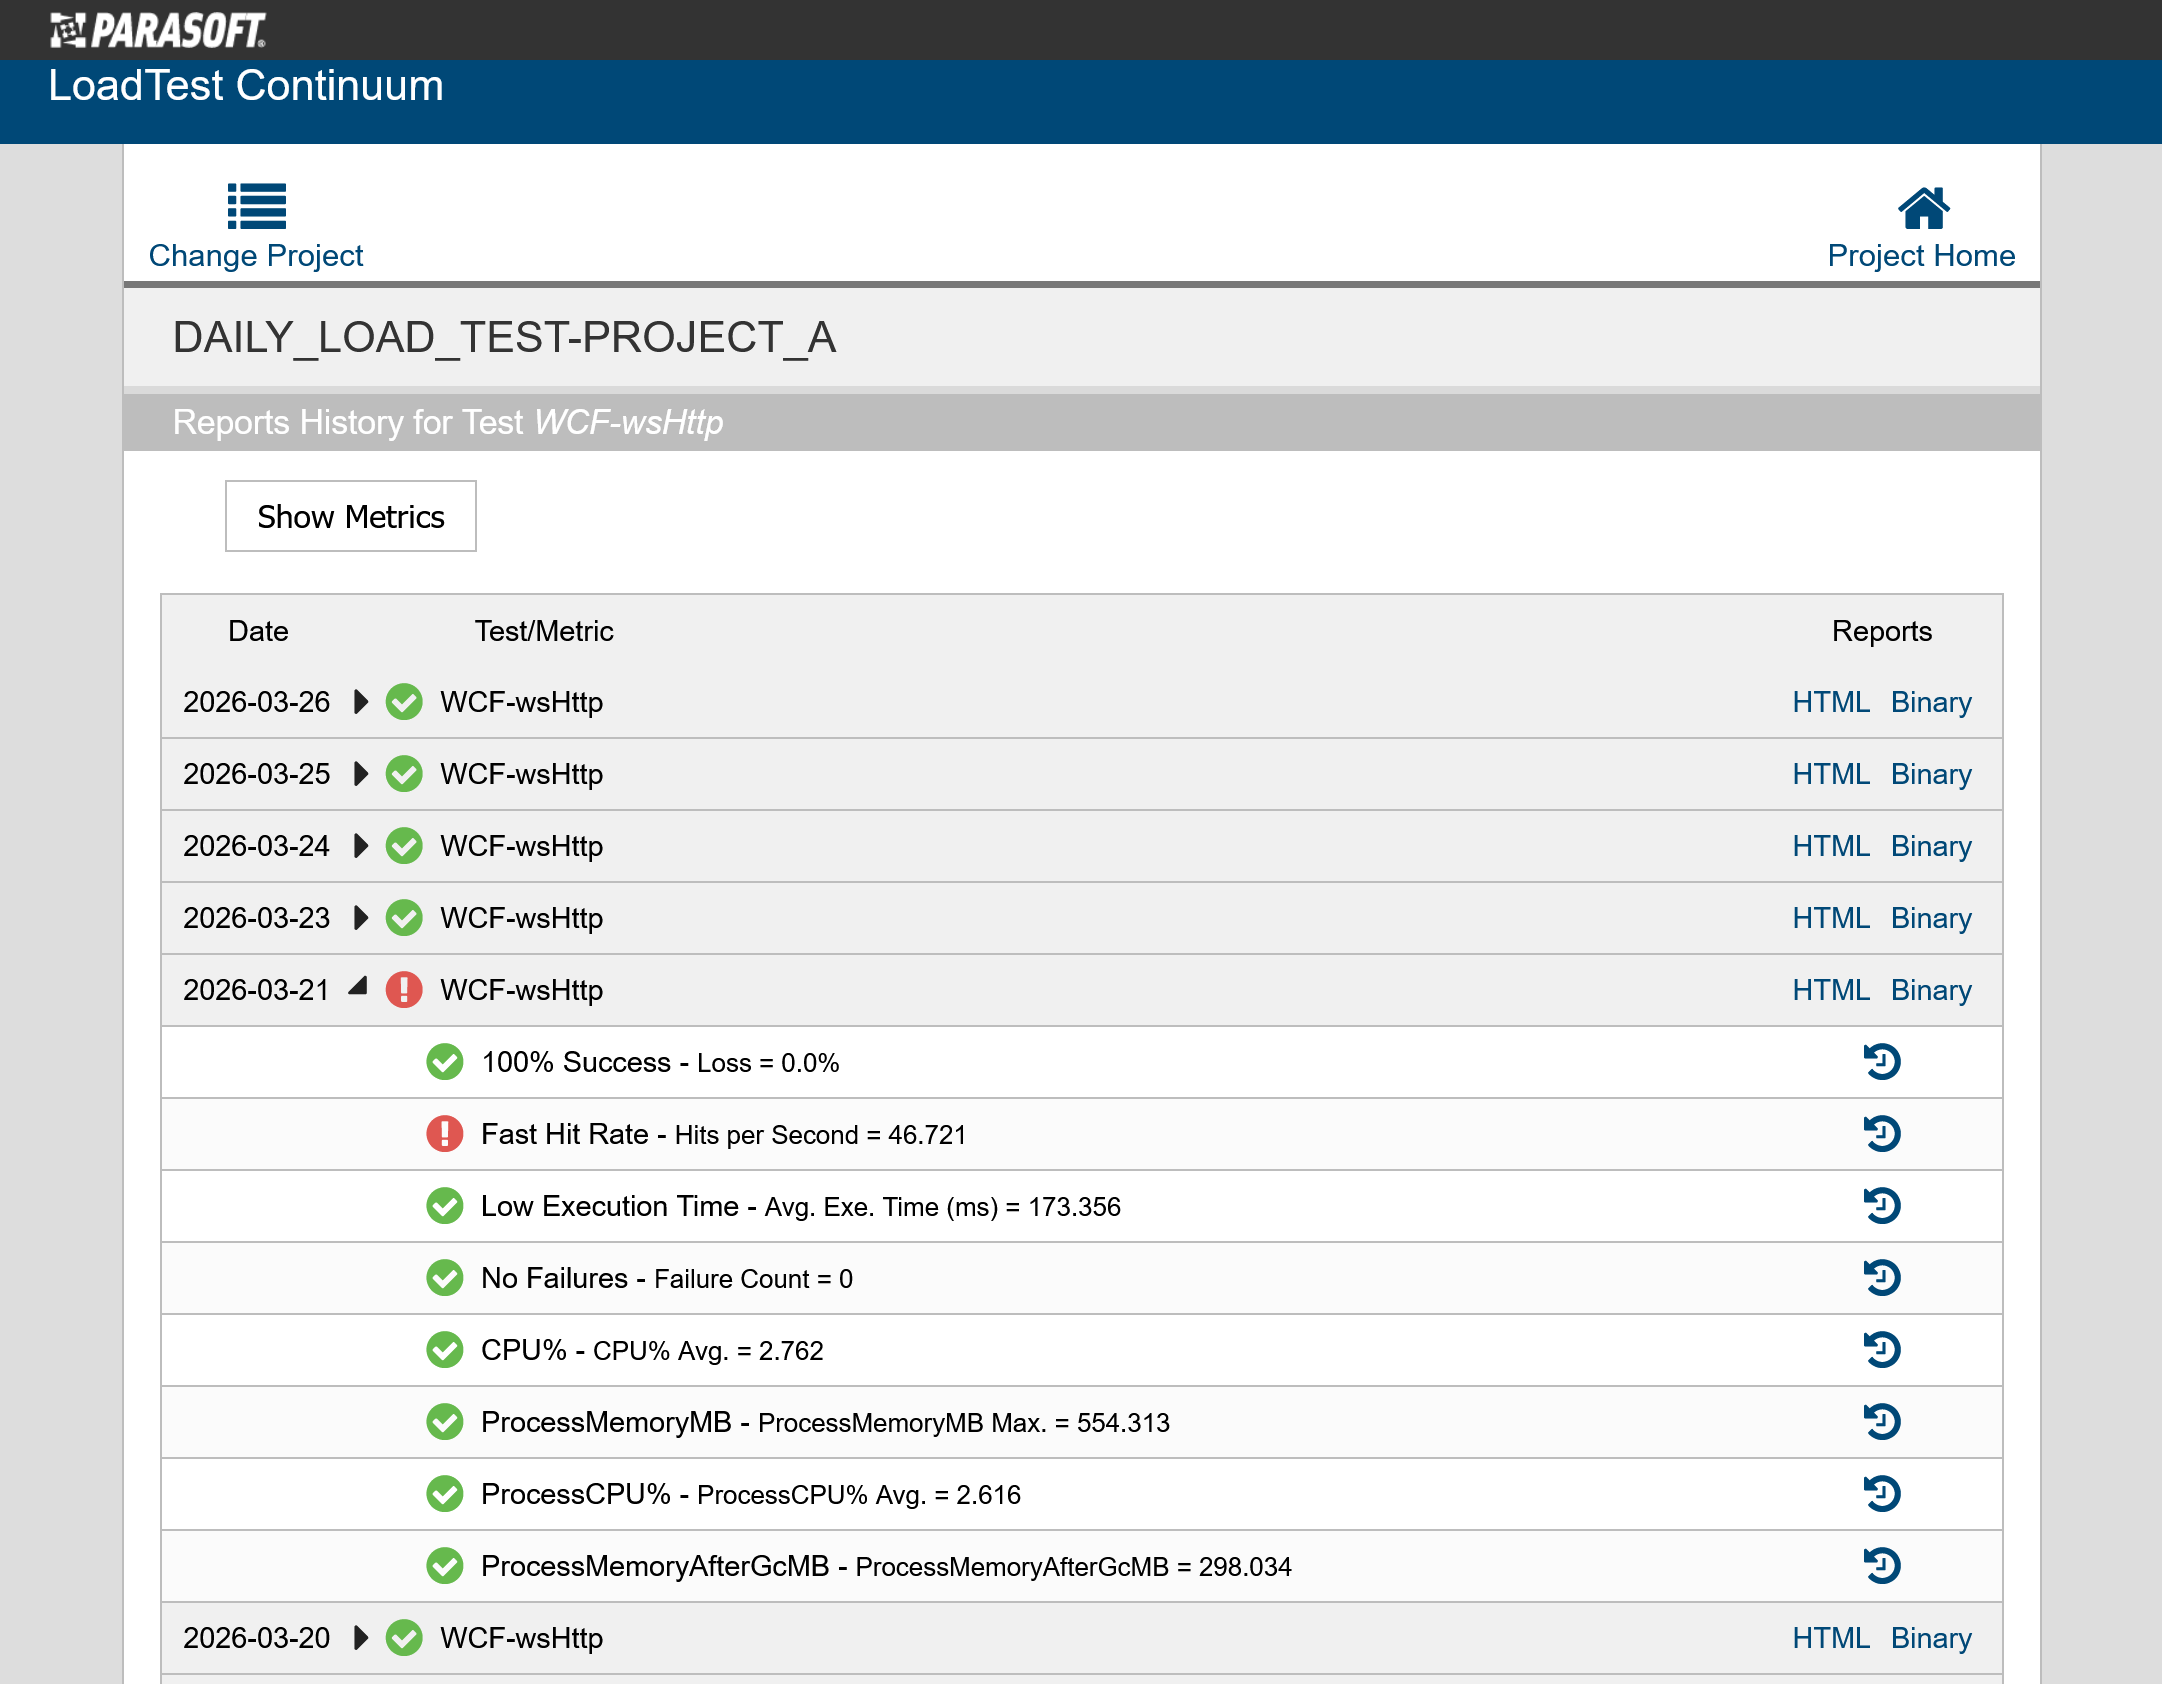
Within the Load Test Reports view, there are various links for Test Reports and QoS Metric Graphs.
...
- History: For the history of that specific test and its QoS metrics.
- HTML: For the Load Test load test HTML report.
- Binary: For the binary Load Test load test report.

Individual QoS Metric Graphs
...
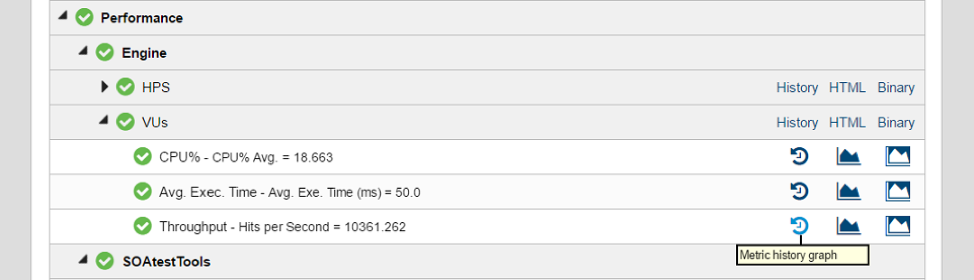
To view the numeric metric history for a single test, click the Metric history graph icon next to the metric you want to view:

A numeric value history graph will be shown:
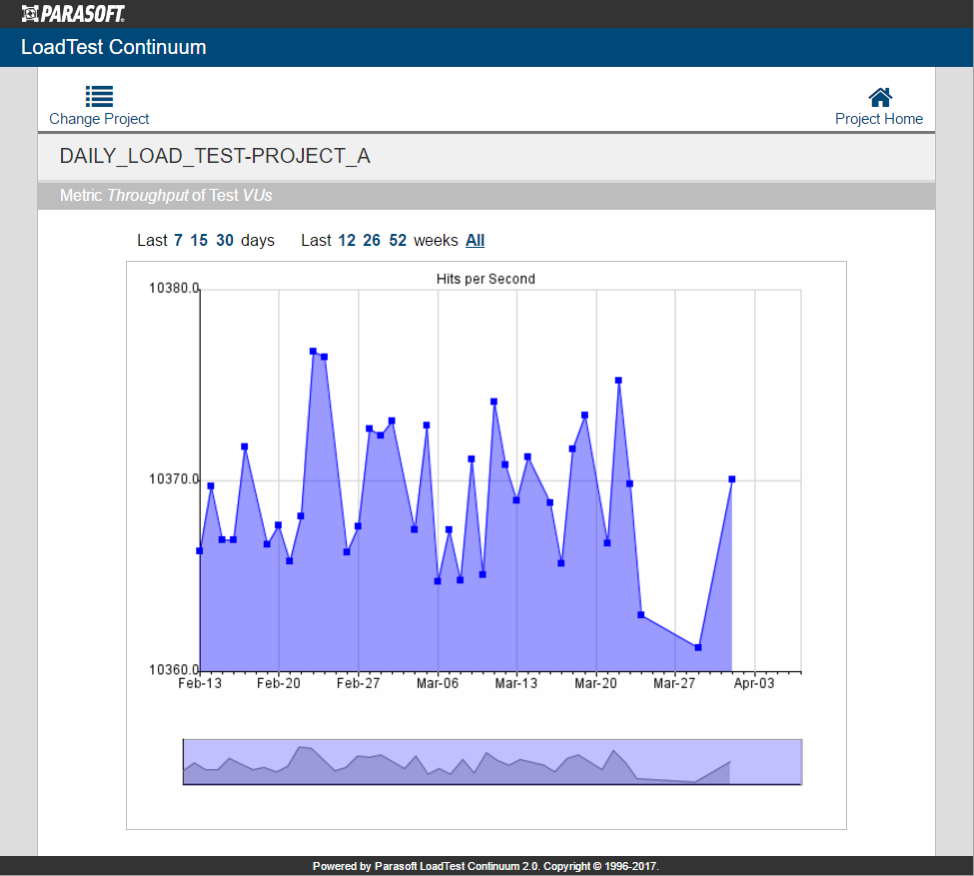
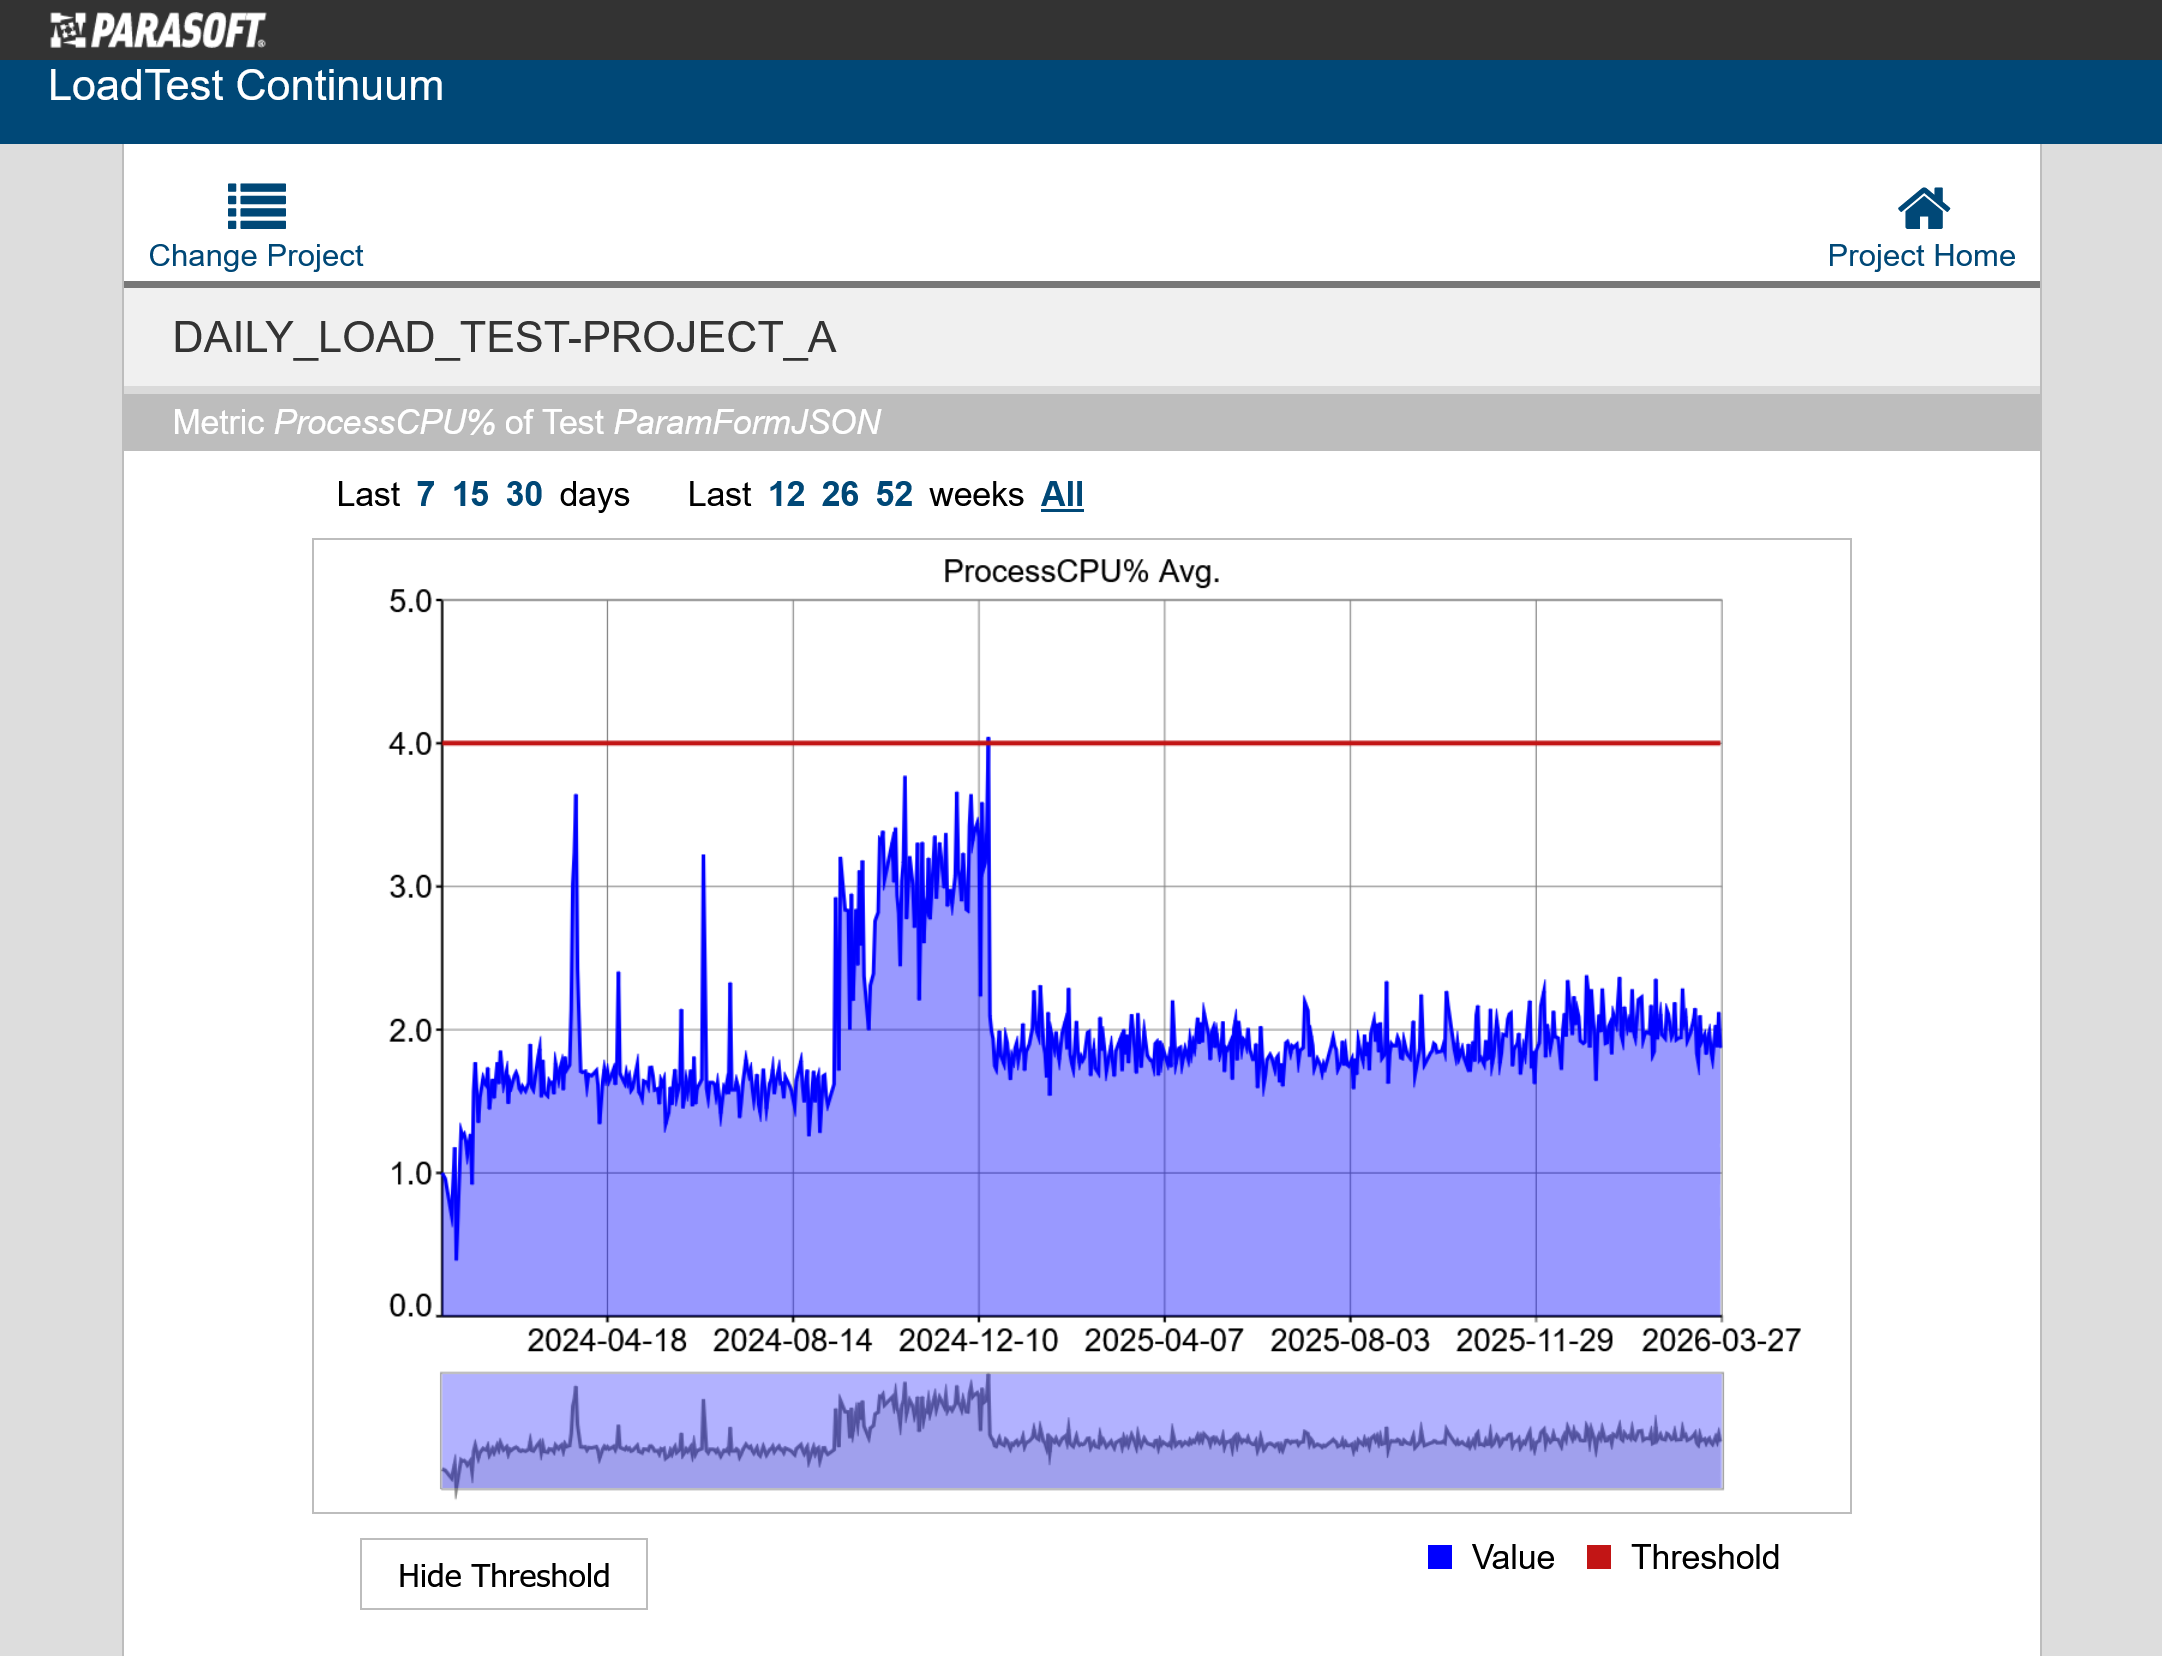
The numeric QoS metric graph page displays the metric value graph in the center of the page and a navigation graph under the value graph. The metric graph will show the metric Threshold graph and the metric Value graph. Move the mouse cursor in the graph to select a date. Numeric values for the selected date will be shown in a bubble under the mouse pointer if the selected date has metric data. If the test with the selected metric was not run at the day under the mouse pointer, the value bubble will show “no data”. Click Hide Threshold or Show Threshold to hide or show the Threshold graph. The navigation graph displays all the available data and a highlighted sliding window, which defines the time boundaries of the data graph. To navigate these graphs, you can:
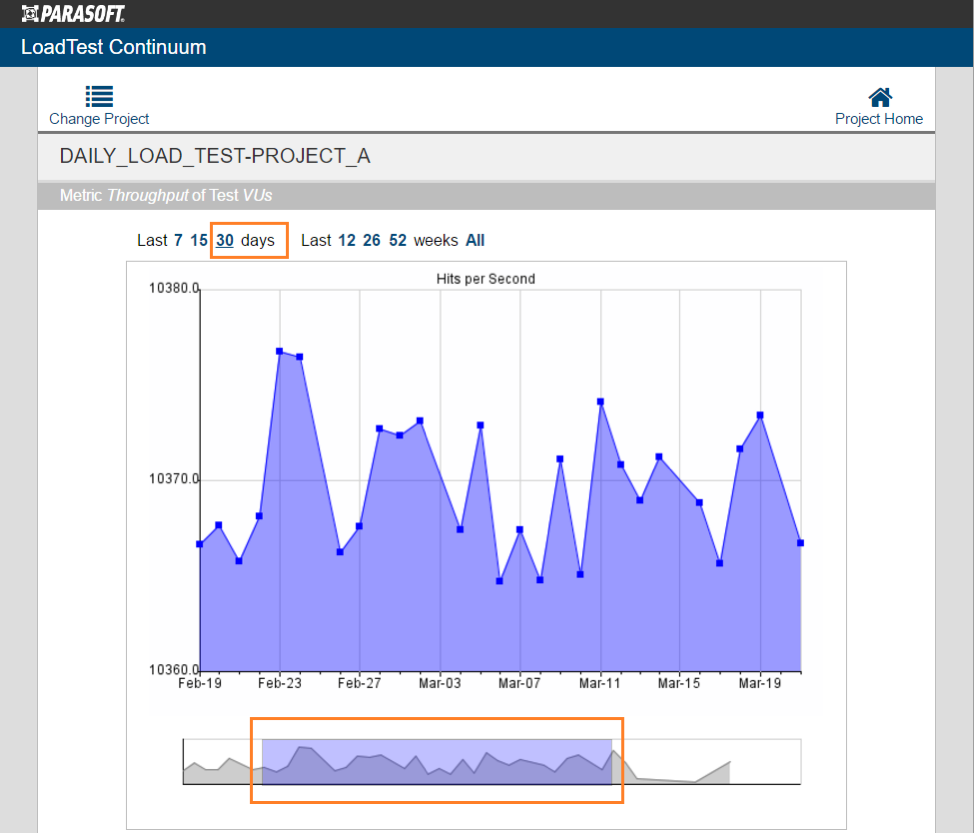
- Change the slider window width by clicking one of the Last 7 | 15 | 30 days and Last 12 | 26 | 52 weeks links in the panel above the value graph.
- Drag the highlighted sliding window of the navigation graph at the bottom of the page; after the mouse is released, the value graph will reload. The values graph will interactively reflect the position of the sliding window in the navigation graph. If the sliding window highlights the entire navigation graph, select a smaller time window interval.

Multiple QoS metric Graphs
...
To view history graphs for multiple tests, click the All graphs of this metric icon next to the metric you want to view:


Multiple QoS metric graphs of the same name are shown: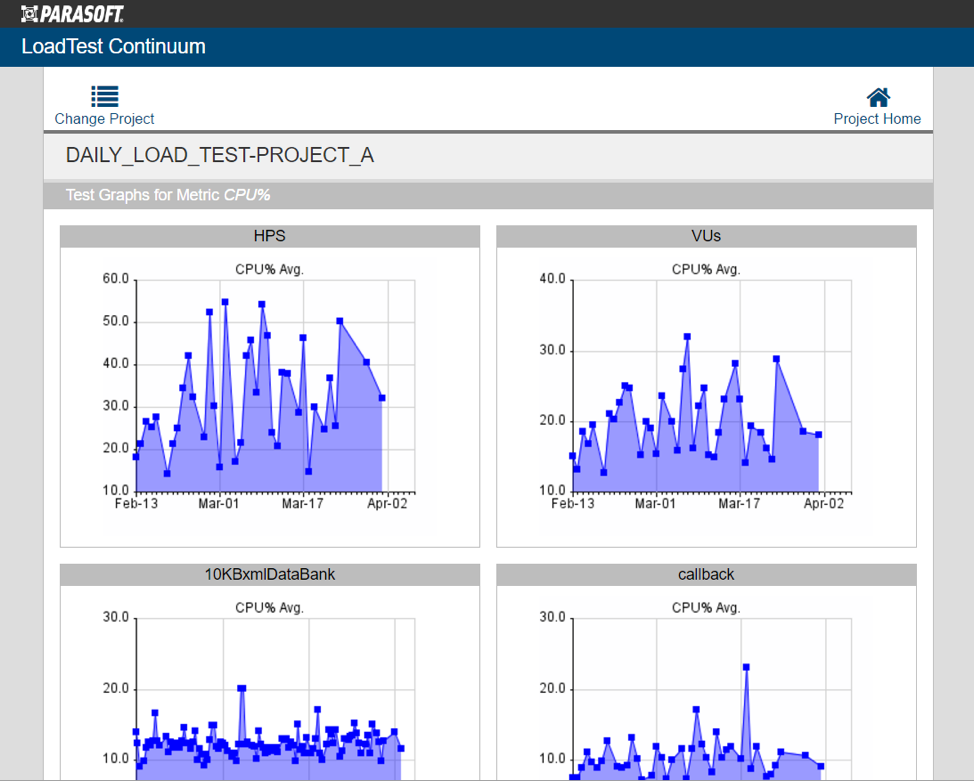
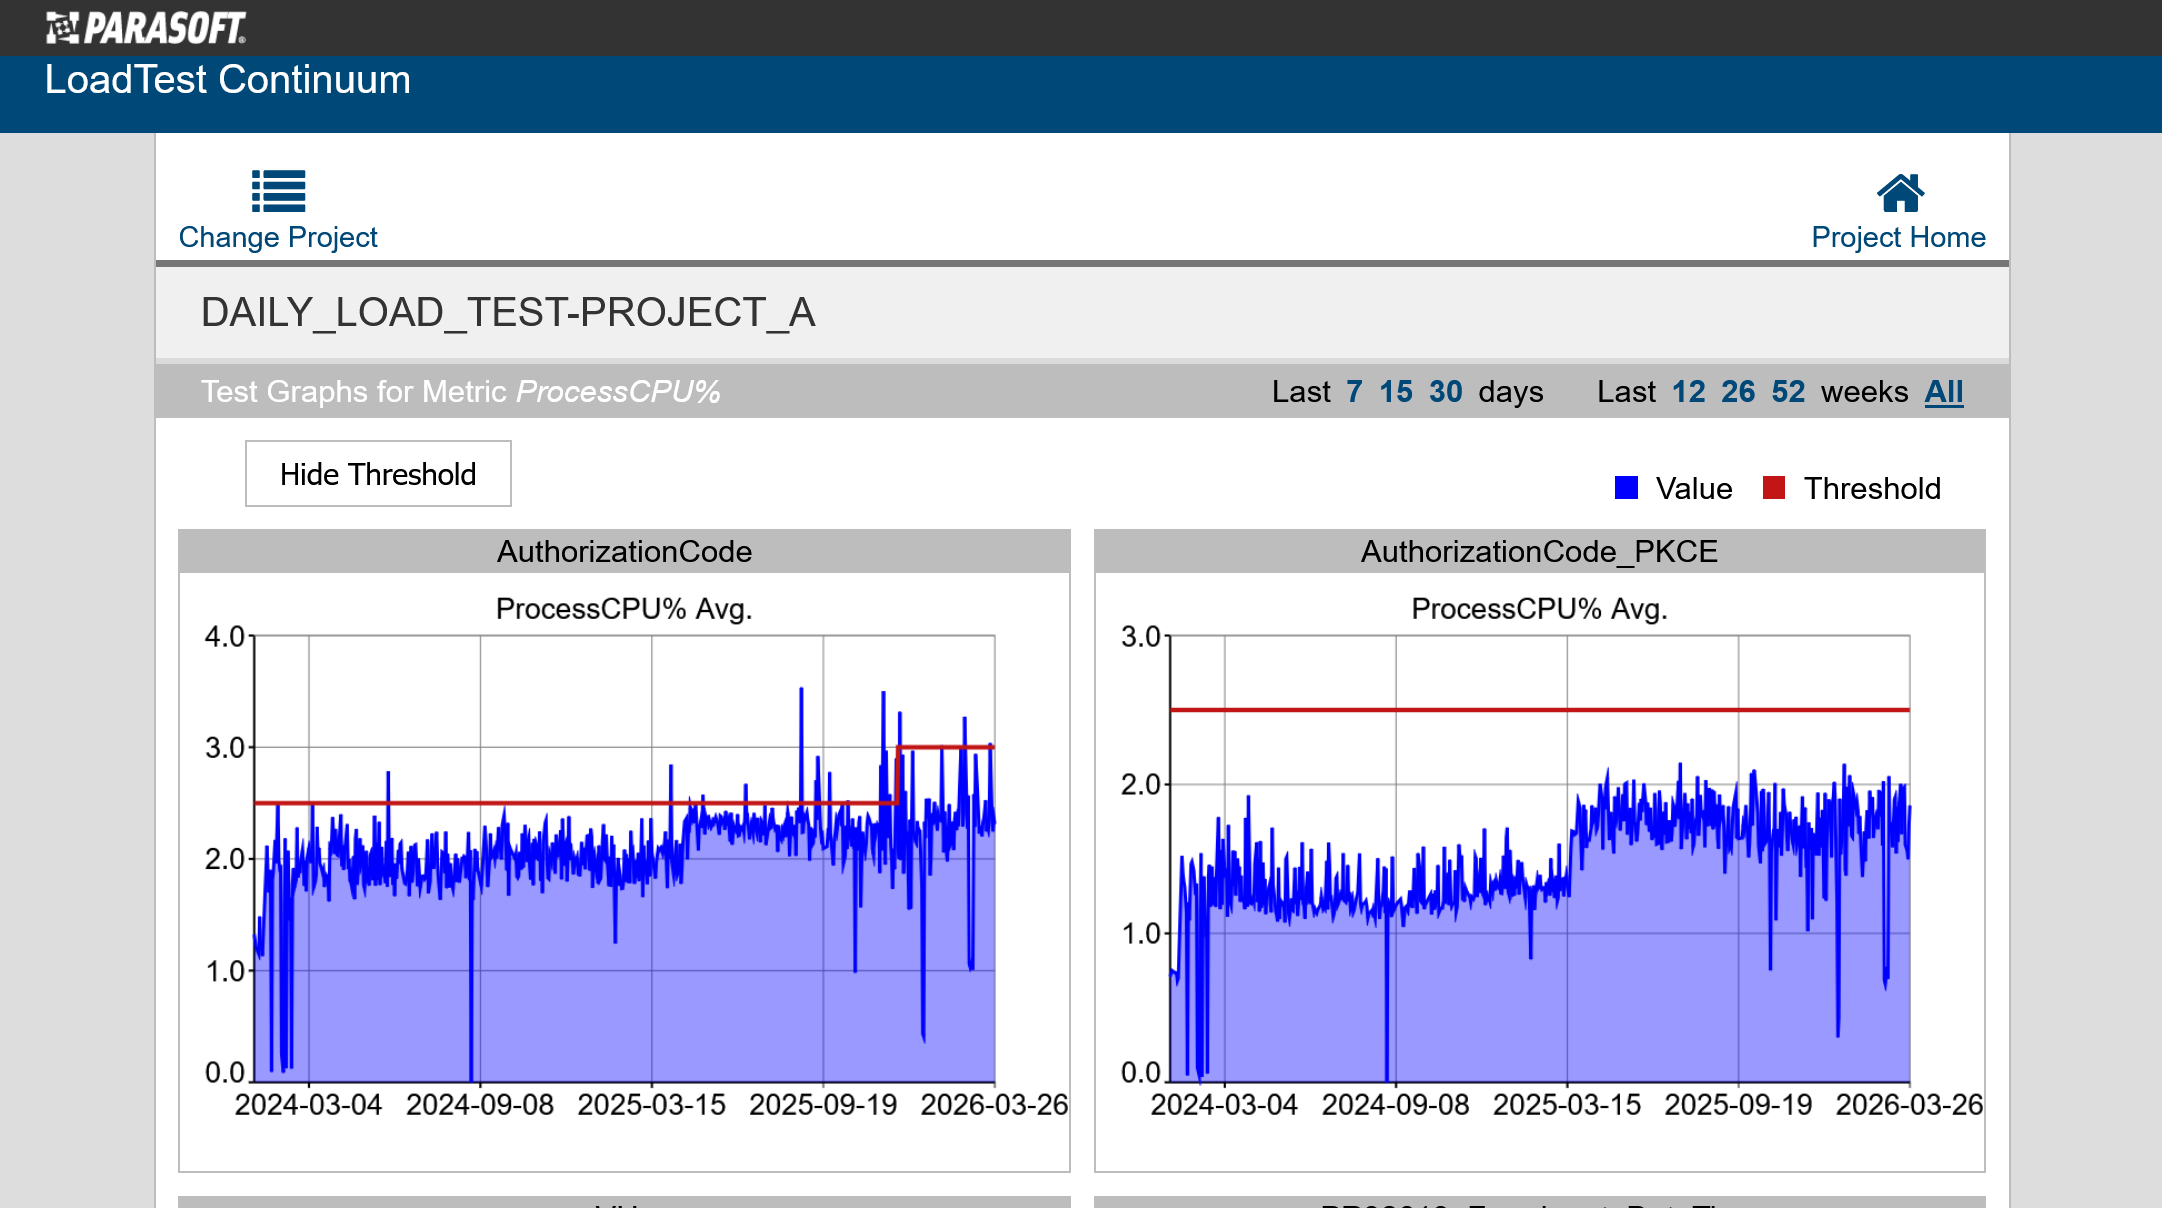
By default, the graphs show all available data. To show only recent data, click one of the Last 7 | 15 | 30 days or Last 12 | 26 | 52 weeks links in the header panel. Click Hide Threshold or Show Threshold to hide or show the Threshold graph.
This type of view is useful when you want to see how a certain metric applies to all of the tests. For example, an "Average Execution Time" metric or a "Failure Count" metric. You can click on each summary graph to view further details and navigation options.
To view all metric graphs of a certain test, click the All graphs of this test icon:


Multiple QoS metric graphs of the same test are shown: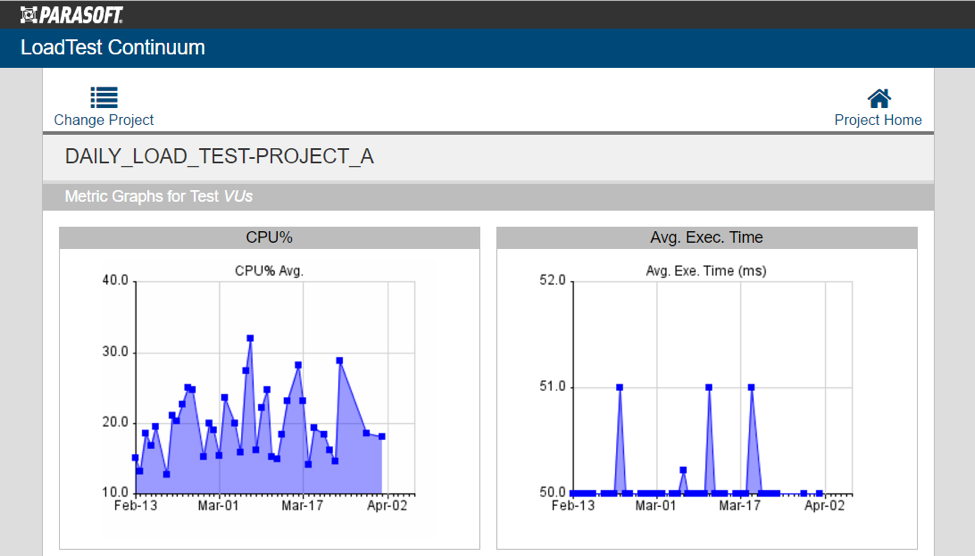
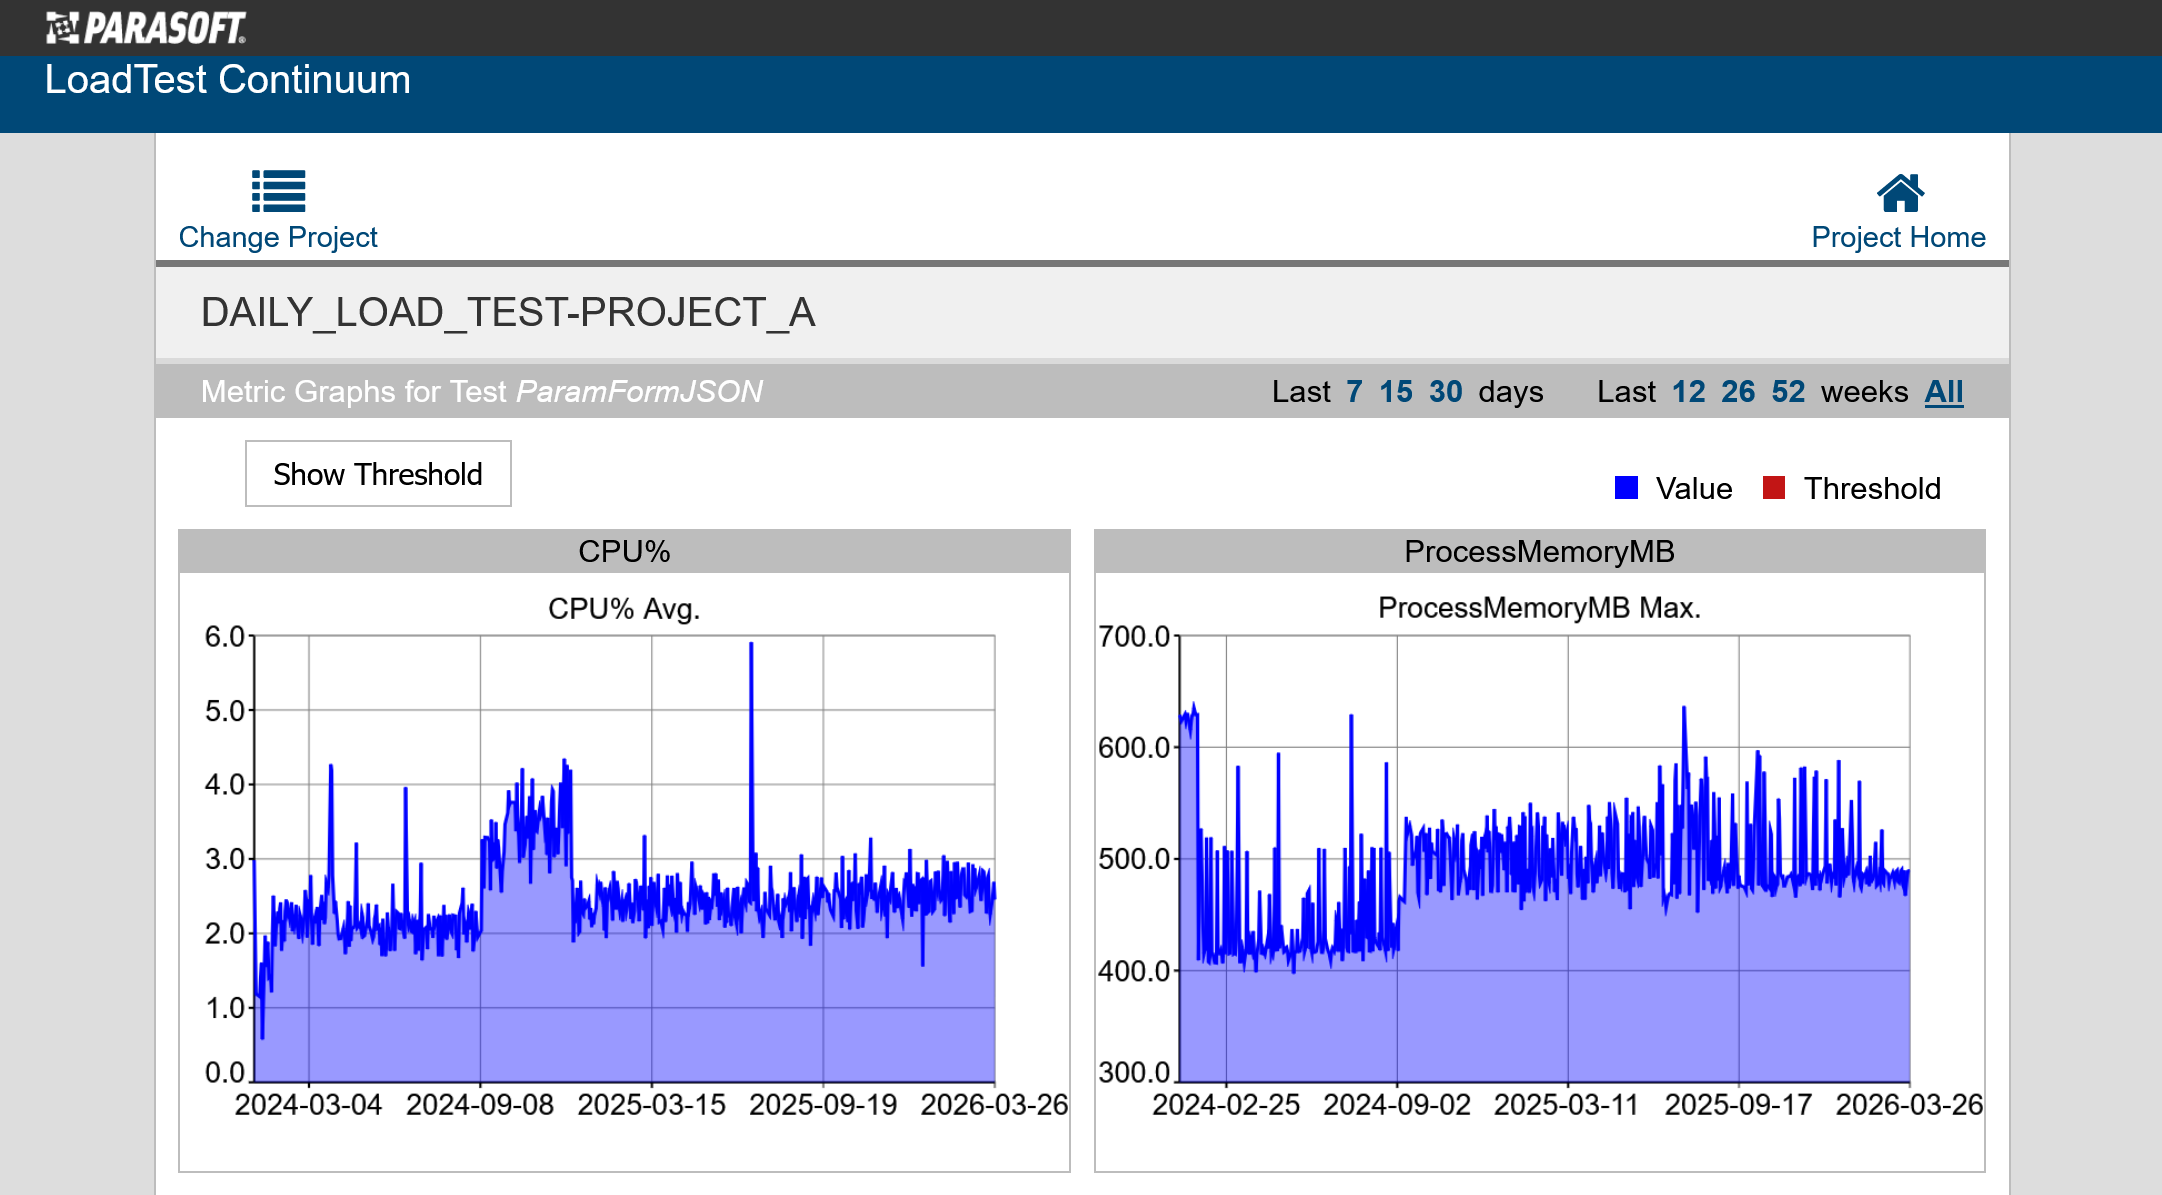
By default, the graphs show all available data. To show only recent data, click one of the Last 7 | 15 | 30 days or Last 12 | 26 | 52 weeks links in the header panel. Click Hide Threshold or Show Threshold to hide or show the Threshold graph.
You can click on each summary graph to view further details and navigation options.
...