This topic explains how you create and use monitors to collect network information and system performance data during load testing. Monitoring metrics can be overlaid onto load test results to help you determine whether the load passed to the Web server is being handled as designed.Supported monitors include:
In this section:
| Table of Contents |
|---|
Supported Monitors
- SNMP
- Windows monitors (available only on Windows installations of Load Test)
- WebSphere
- WebLogic
- JBoss
- Tomcat
- rstat
- remote
- deployed (e.g., AppDynamics, Dynatrace)
- custom
...
- Right-click the Load Test tab’s Monitors node, then choose New Monitors from the shortcut menu. A New Monitors dialog displays.
- Select WebLogic from the New Monitors dialog, then click Finish.
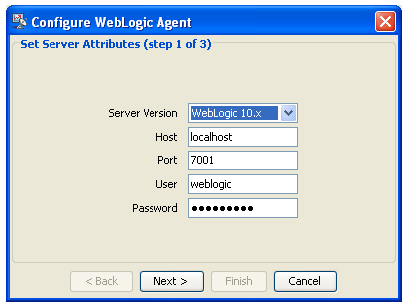
In the Project Configuration panel, click Configure. A Configure WebLogic Agent dialog displays.
Note title Note For WebLogic 8.1 SP6 and WebLogic 9.x monitors, Load Test needs to be started with the
-Dsun.lang.ClassLoader.allowArraySyntax=trueoption. To do that in the command prompt, navigate to the Load Test installation directory and run the following command:lt -Dsun.lang.ClassLoader.allowArraySyntax=true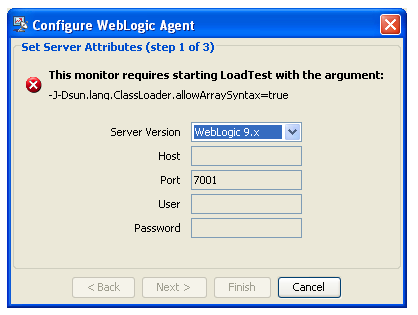
- Enter the Host name, change the Port number if necessary, then click the Next.
- In the Configure WebLogic Agent panel, enter or browse to the appropriate Path of the desired WebLogic implementation on your machine. For example: C:\Oracle\Middleware\wlserver_10.3.
- Click Next. The Configure WebLogic Agent dialog displays a table of the required Jar files for the server and indicates whether or not the appropriate Jar files were found.
- In the Configure WebLogic Agent dialog, click Finish. The Add Parameter dialog opens.
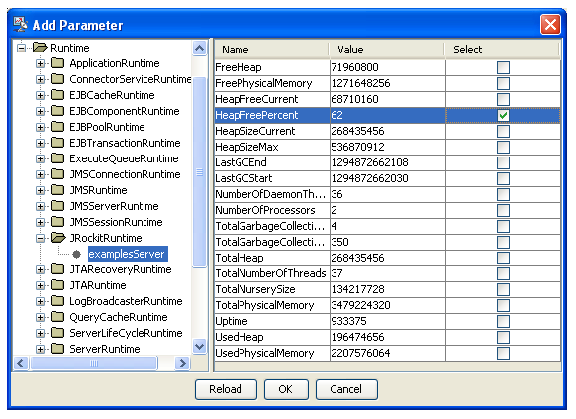
- Select a Parameter from the left GUI panel of the Add Parameter dialog. The Name, Description, and Value for each instance of the parameter you want to monitor displays in the right GUI panel of the Add Parameter dialog.
- In Select column from the right GUI panel, check the parameter instances that you want to monitor, then click OK. The parameters you choose will display in Load Test Progress graphs, and in Detailed Report graphs.
...
| Note | ||
|---|---|---|
| ||
For rstat monitors to be enabled, The rstatcl.jar is added to <SOAtest_Installation>\<SOAtest_Version>\eclipse\plugins\com.parasoft.xtest.libs.web_<version>\root upon installation. The djrpc.jar must be purchased and copied to <SOAtest installation>\eclipse\plugins\com.parasoft.xtest.libs.web_<version>/root. |
...
Adding Remote JVM Monitors
...