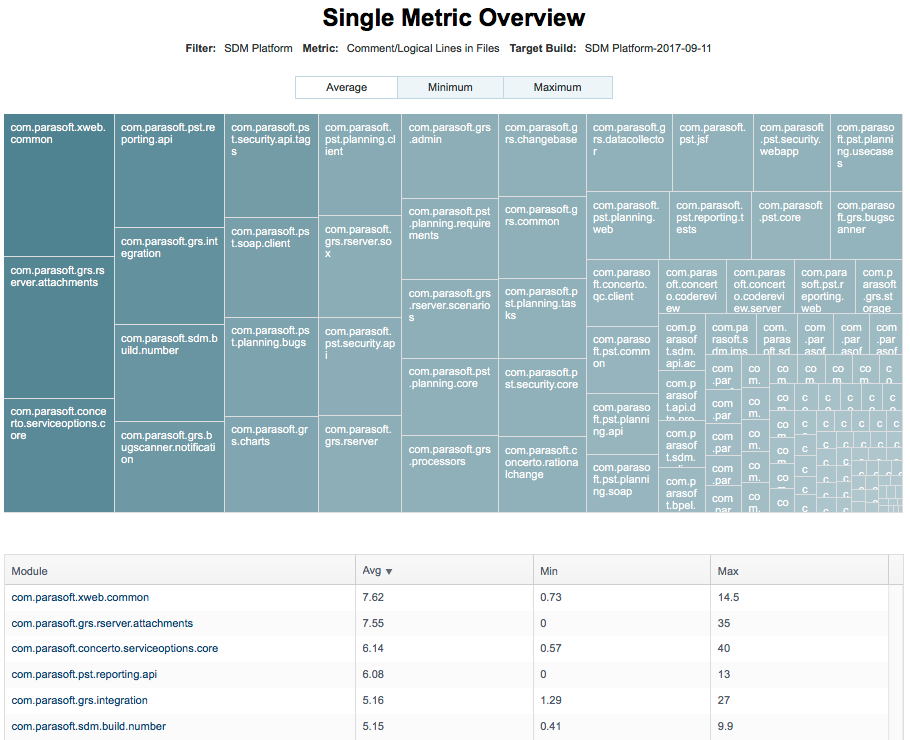
This report shows how data for one metric is aggregated across the modules in a selected filter and target build. It shows a heat map in which larger, darker tiles contain a higher metric value within the project. Conversely, the smaller lighter tiles have lower metric values. The report also represents the data in a table view. You can access the report by clicking on a value in the Metrics Overview widget or by clicking the more... link in the Top 10 Modules Metrics - Tree Map widget.
You can perform the following actions:
...