...
After a tool is executed, double-click the Traffic Viewer node beneath the test to view that tool’s traffic. The following components are available in the Traffic Viewer tool:
- Test Run: Displays Shows the timestamp of the selected test case.
- Remove: Click to delete the selected Traffic instance from the Test Run drop-down menu.
- Clear All: Click to delete all the Traffic instances from the Test Run drop-down menu.
- Save Traffic: Select to save traffic data (requests and responses). If this option is not selected, traffic will be lost after the project is closed.
- Request URLs: (Only available when attached to a Browser Browser Playback tool) : Shows the various browser request URLs for which traffic is available.
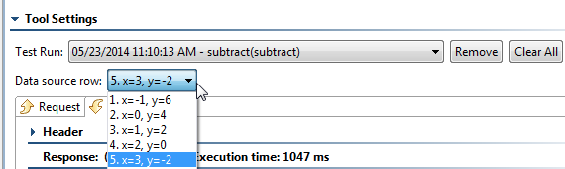
- Data Source Row: Displays Shows data source row values sent within the traffic. (The Data Source Row menu only displays appears if a data source was used for the corresponding test case.).
- Request/Response tabs: Displays the Request or Response Header and Body that corresponds to the selected test from the Test Run drop-down menu menu and also (if applicable) to the selected Data Source Row.
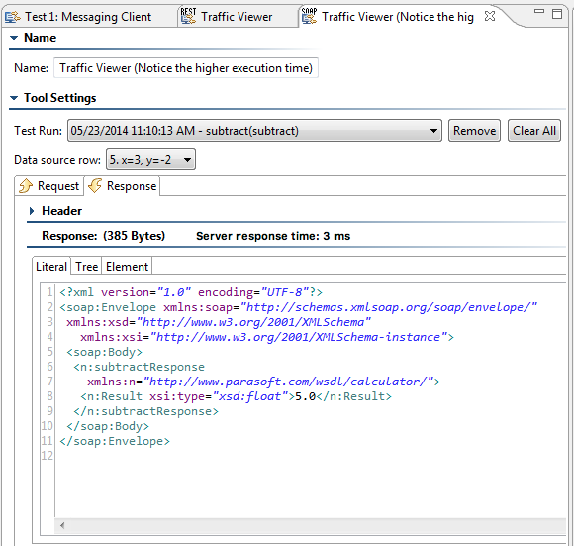
For client and stub tools, you can view the request and response body via three different tabs:
- Literal: This tab is shown by default. If If you find that you have to scroll from left to right to view the traffic, you can right-click within the tab , then and choose Beautify. You can also reformat XML to fit on one line by right-clicking in the tab and choosing Compact.
- Tree: The Tree tab allows you to view the Response body via a tree view.
- Element: The Element tab allows you to view a simplified version of the message.
| Info | ||
|---|---|---|
| ||
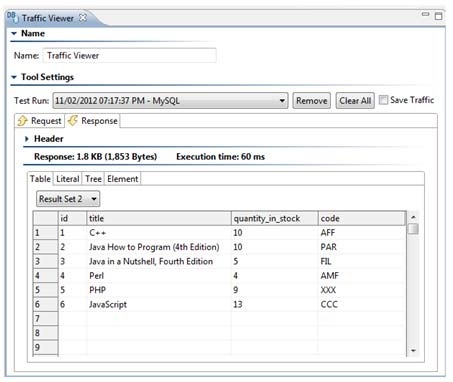
If the Traffic Viewer is attached to a DB tool and a "SELECT" statement is executed by the DB tool, the Response area will show a table that contains the results of the DB query. When a DB tool tool executes multiple SQL statements and the response includes multiple result sets, you can use the combo box (menu above the table when there are multiple result sets ) to determine which result set’s traffic is shown. HereFor example, here the traffic viewer is showing the results for Result Set 2:
|
...