...
Select the Scenarios node in the Load Tests tab. The Report Settings displays appear in the right GUI panel.
Note title Note If the Load Tests tab is not active, right-click anywhere in the Projects tab and select choose Create Load Tests from the shortcut menu. - In the Report Settings panel, select the enable Record graph data and error details checkbox. A detailed scenario report will be created after the completion of a load test. For more information on detailed reports, see Detailed Reports.
After selecting the enabling Record graph data and error details checkbox, the following options are available:- Record first: Select this radio button Enable and enter a number in the text field to record the first number of error details you specify. The Record first option is useful in preventing the detailed report files to grow to unmanageable sizes if a large number of errors are produced. By default, the first 300 error details are recorded.
- Record all: Select this radio button Enable to record all error details in the detailed report.
- Record individual hits: Select Enable to record individual hits and to have Load Test create a histogram as part of the detailed report after completion of a load test. You will also have the option to display individual hits in graphical and table forms within the Detailed report.
...
Load test results are available in the right GUI panel after a load test completes. To open this window at a later time:
- Select Window> Go to Window > <Scenario Name>.
Load test results display in the right GUI panel with the following menu options:
- Views: Determines what type of report is displayed.
- To view a summary of test information, choose Test Information.
- To view detailed test statistics, choose Statistics.
- To view test execution messages reported by tools involved in the test, choose Messages. The Messages view is only visible if tools generated an error message. It reports only one instance of each error message reported--, even if a certain message was reported multiple times. To view details about an error message, double-click the related entry in the Messages view.
- To view the detailed report, choose Detailed Report.
- Machines: Determines which machine results are displayed. Select from any available instances to display machine results. The default is All Machines.
- Profiles: Determines which profile results are displayed. You may select any of the profiles that you created. The default is All Profiles.
- Tests: Hides or shows the Tests tree selection panel. The selection in that panel determines which test results are displayed. You may select any combination of the tests that is available in the listed test suite. By default, all Tests tree nodes are selected.
...
From the Test Tree selection panel, you can select All Tests, All Test Suites, All Test Requests (if there are requests in the report) All, or None test tree nodes by choosing the appropriate item in the dropdown menu of the Select button below the Tests tree selection panel:
...
The Propagate Selection option (unselected by default) allows you to apply the selection to an entire sub-tree. For example, if you select/unselect a tree node that has child nodes, all the child nodes will be selected/unselected as well.
Understanding Available Reports
...
- The Hierarchical layout displays test results in a tree-table format that matches the order of tests in the functional project (i.e. that is, the SOAtest project) that was used to run the load test. To preserve the report hierarchy in Hierarchical layout, the sorting of the tree-table nodes is performed within the scope of the parent node. If you need to sort all Statistics results, you can switch to the Flat table layout.
- The Flat layout allows you to sort all test results by a parameter of your choice. It displays the test path of each test in Test Path column. It also displays the path of the selected test in the Report Path sub-panel at the bottom of the table view.
...
When viewing the Statistics report, an Output Types menu is available. The Output Types menu determines what type of output report is displayed. Two types of reports are available from this menu, each of which displays different columns of information. The differences between report types are:
- Generic Reports: Contains Test Suite name, Test Index, Test Name, Min/Max/Avg Time (ms), Std. Deviation (ms), Run Count, and Failure Count. Also Also contains 99th, 98th, 95th, 90th, 85th, 80th, 70th, 60th, 50th, 25th, and 10th percentiles when individual hits have been collected.
- Network Client Report: Contains all of the information in Generic Reports plus Min/Max/Avg Ping (ms), Min/Max/Avg Request Size (bytes), Min/Max/Avg Response Size (bytes) Min/Max/Avg Total Size (bytes).
If some of the machines were configured to run in the High Throughput Mode, the available report types will be:
- Unverified Report Mode: Contains Run and Failure counts for Tests in Verified Mode, Run counts and Failure Estimate intervals for Tests in Unverified Mode as well as the Total Run count and Failure Estimate. The user can choose the Confidence Level percent value that will be applied to the Estimated error intervals in the report.
- Verified Mode Generic Reports: Same as Generic Reports in non-High Throughput Mode.
- Verified Mode Network Client Report: Same as Network Client Report in non-High Throughput Mode.
Customizing Available Statistics Report Columns
...
- Right-click the table area of the Statistics Report .Choose and choose Select Columns from the shortcut menu.
- Use the controls in the Columns Configuration dialog box to specify which columns you want shown.
- (Optional) If you want Load Test to apply this same configuration to all subsequent load test reports for the current project, click Save Configuration before closing this dialog box.
...
To access details about a specific test failure, double-click the related report row. You can determine whether a given test failed by locating the row that represents that test, then checking the number in that row’s Failure Count column. Load Test will show the details of the last error of the test. You can view all errors of a a specific test in the Detailed Report section, which is described in Viewing Detailed Report Table Content.
...
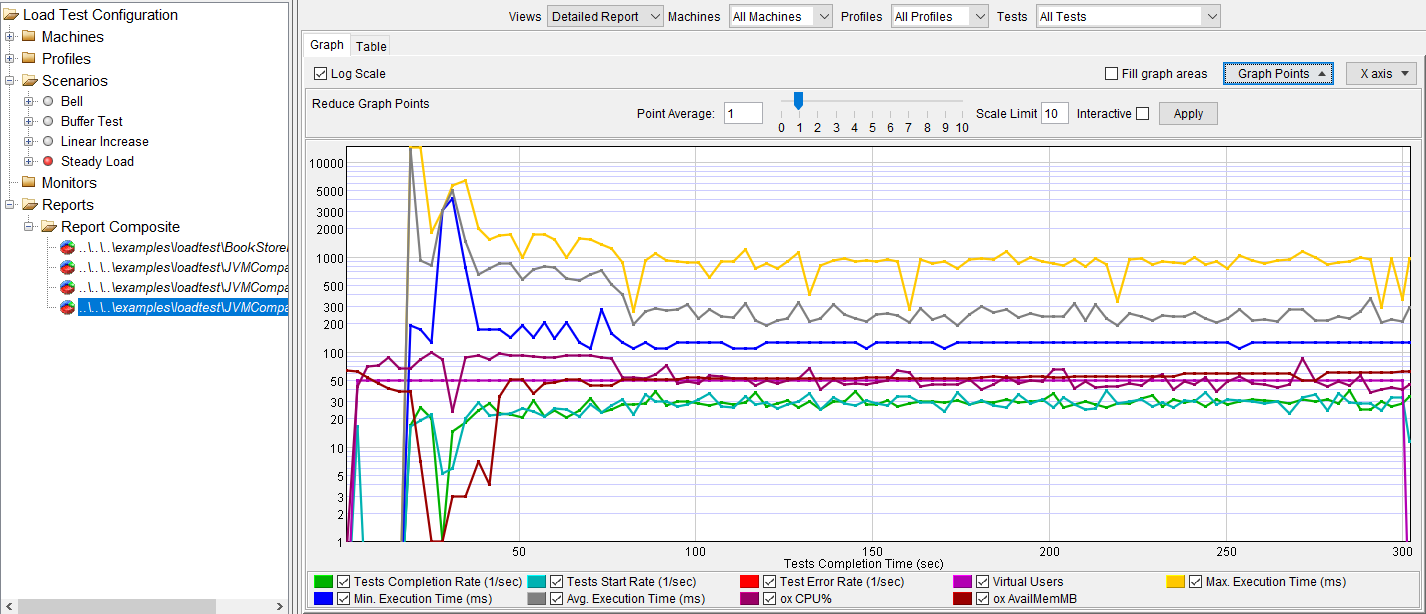
The Detailed Report contains the following tabs:
- Graph: Displays all possible graphs for the individual load test.
- Histogram: Displays the distribution of values for the selected variable (execution time, request size, response size).
- Table: Displays either the errors or individual hits that occurred for the load test.
In addition, the results in each tab of a Detailed Report can be filtered through the drop-down menus located at the top of the right GUI panel. Load test details that display are filterable displayed can be filtered by Machines, Profiles, and Tests.
...
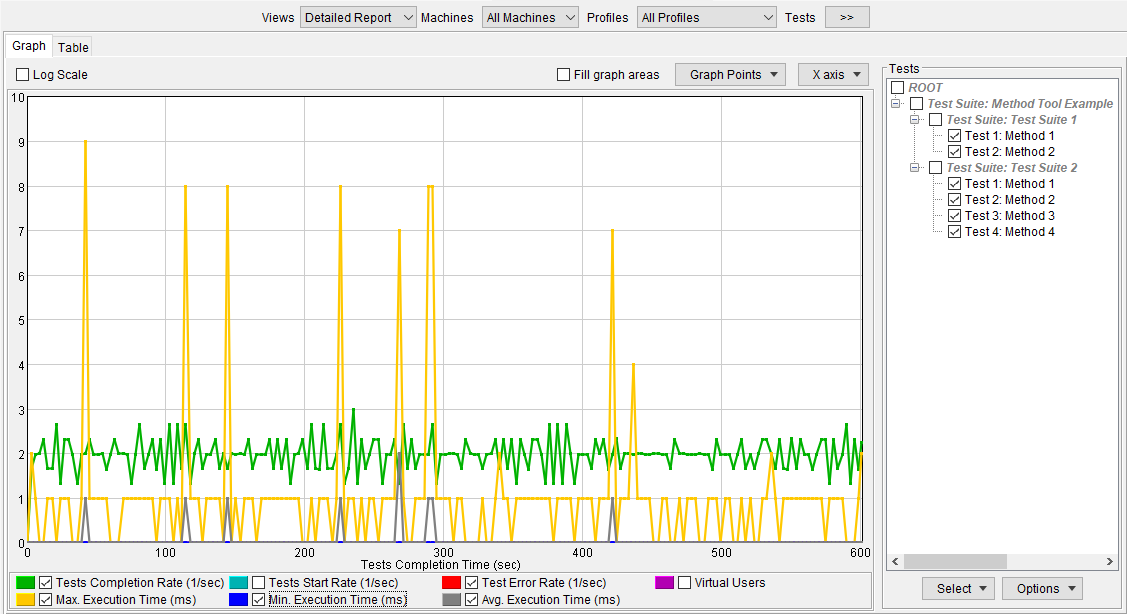
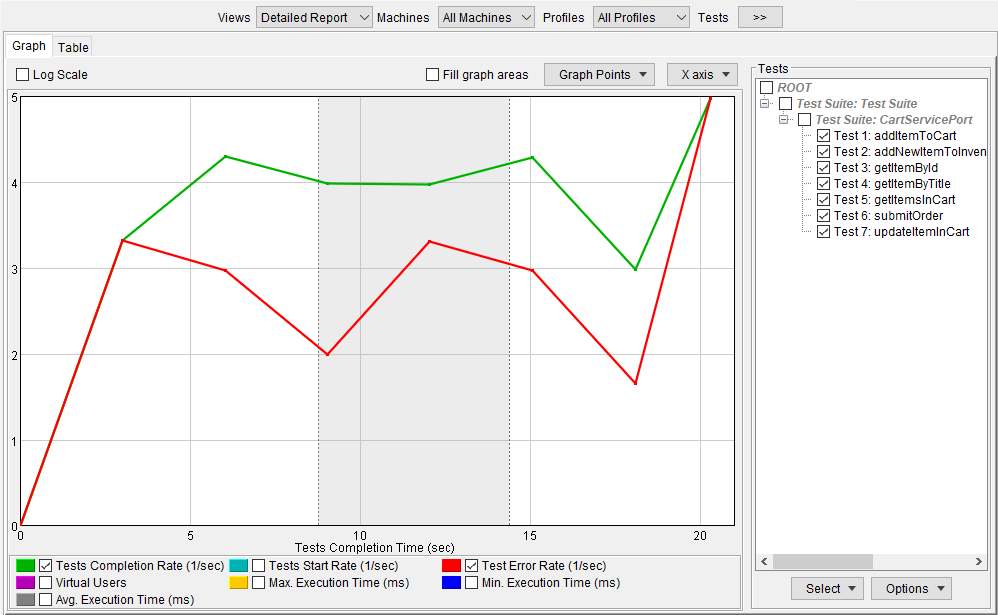
Note that the Tests tree filter allows you to have graphs include test suites, tests, and, for browser tests, browser request reports. When evaluating the load that is applied to the system under test, be aware of this and select the appropriate subset of reports that applies to your testing scenarios. For example, if you run a load test based on SOAtest SOAP Clients, you may want to select only Test nodes (see screenshot below) to view the graph of SOAP Client requests to the system under test. You would select Test Suite nodes only if you wanted to see the graph of transactions that include multiple tests.
...
The following options display in the Detailed Report Graph tab legend:
- Tests Completion Rate: Select Choose to display the rate of the tests completed over time in the graph.
- Tests Start Rate: Select Choose to display the rate of the tests started over time in the graph.
- Test Error Rate: Select Choose to display the rate of errors over time in the graph.
- Virtual Users: Select Choose to display the number of virtual users over time in the graph.
- Avg. Execution Time: Select Choose to display the average execution time of the load test.
- Max. Execution Time: Select Choose to display the maximum execution time of the load test.
- Min. Execution Time: Select Choose to display the minimum execution time of the load test.
- Monitor Parameters: Select Choose to display data collected from any SNMP, Windows, or JMX Monitors you added to the Monitors node of the Load Test tree. The names of the monitor parameters are based on the monitors’ Host and Graph Title values. For example, if you added a monitor and entered "
ox" for the Host, and "SNMP TCP Established" for a Graph Title, you will see a check box labeled "ox SNMP TCP Established" in the Graph tab during load test progress. For more information on monitor parameters, see Using Monitors.
...
There are a variety of ways to customize the report content of the Detailed Reports Graph tab.
To filter the graphical data displayed:
...
- Choose values from the X axis box. The graph will change accordingly. To see more options in the X axis box, check the enable More X-axis options check box.
To change the report’s Y axis from the default linear scale to a logarithmic scale (or vice versa):
- If you want to use a logarithmic scale, check theenable Log Scale check box. A logarithmic scale allows you to see the shape of multiple curves on the same graph (even if the displayed values are very far from one another). For example, if the total loading time is between 1000 ms and 200 ms and the number of users is between 10 and 20, you will not be able to see the users' values if the graph uses the linear scale (the graph will be a flat line close to 0). If you use a logarithmic scale, you will be able to see loading time values as well as the users' values.
- If you want to use the linear scale, clear the disable Log Scale check box.
To fill in a graph area with its designated color, check the enable Fill graph areas check box.
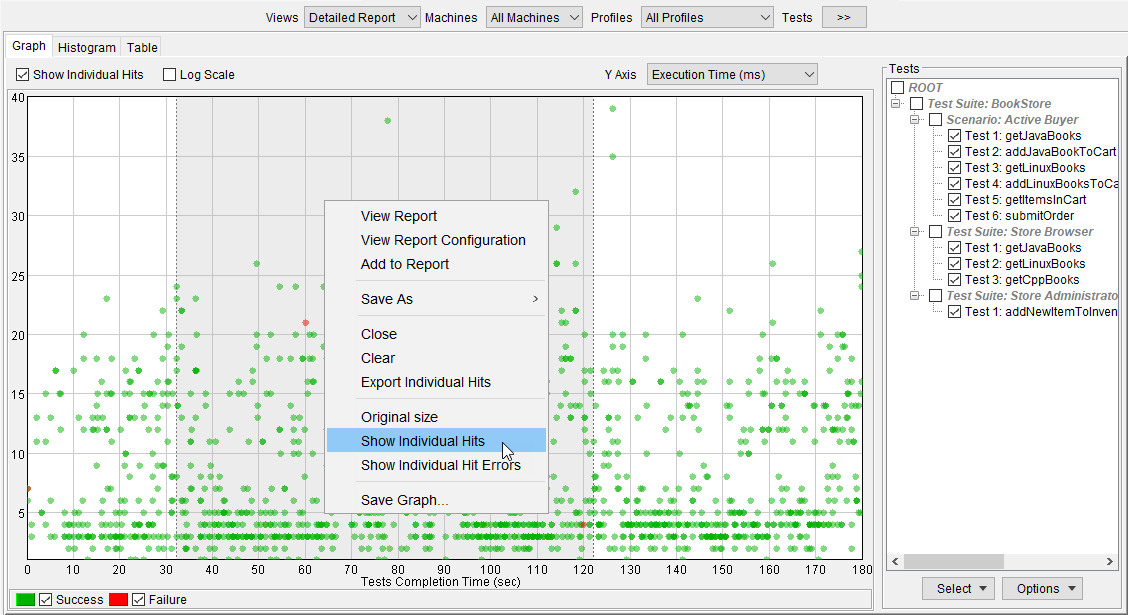
To display the individual hits that occurred during the load test as individual points:
Select the Enable Show Individual Hits check box. All of the individual hits that occurred during the load test displays display in the graph tab.
Hovering over a hit with the mouse will display a tool tip with hit statistics.Note title Note Individual hits can only be displayed in a Detailed Report if the Record individual hits option was preselected from the Report Settings tab of the Scenarios configuration panel. For more information, see Preselecting Detailed Report Options.
To reduce the number of graph points, in cases when there large reports for long running load tests (12 hours or more), click the arrow button to expand the Reduce Graph Points box. The following options are available:
- Point average: Specifies the point average applied to the graph and corresponds to the increments on the slider bar.
- Scale Limit: Enter the scale limit to be applied to the slider bar. The max value is 500.
- Interactive: Select this checkbox Enable to make the slider bar interactive. If this is selectedenabled, moving the slider bar will simultaneously alter the graph. If this is not selectedenabled, you must move the slider bar and then click the Apply button to alter the graph.
To zoom in on a specific area of the graph:
- Click and drag to place a gray box around the area you want to focus on.
- Right-click the newly - created box , then and choose Zoom to selection from the shortcut menu.
To zoom in and out on the graph:
- Move the mouse while pressing the left mouse button and CTRL on the Ctrl keyboard button.
- Rotate the mouse wheel to zoom in and out of the view.
...
- Move the mouse while pressing the left mouse button and SHIFT on the Shift keyboard button.
To return to the original graph size and/or position:
- Right-click any area of the graph , then and choose Original Size from the shortcut menu.
To export and save individual hits in CSV format:
- Filter the individual hits that display by making the appropriate selections from the Machines, Profiles, and Tests menus.
Select the Enable Show Individual Hits check box. All of the individual hits that occurred during the load test displays in the graph tab.
Note title Note Individual hits can only be displayed in a Detailed Report if the Record individual hits option was preselected from the Report Settings tab of the Scenarios configuration panel. For more information, see Preselecting Detailed Report Options. - Complete one of the following:
- Right-click any area of the graph , then and choose Export Individual Hits from the shortcut menu. This will export all individual hits that occurred during the load test.
- Specify a time interval by moving the mouse while pressing the left mouse button and ALT on the Alt keyboard button to place a gray box over the desired time interval on the graph, then right-click the gray box and choose Export Individual Hits from the shortcut menu. This will export all individual hits that occurred during the specified time interval.
- Click and drag with your mouse over any area of the graph and create a gray rectangular box to specify an (x,y) region, then choose Export Individual Hits from the shortcut menu that appears. This will export all individual hits that occurred within the specified (x,y) region.
- In the dialog box that opens, choose the location to where you would like to save the CSV file.
...
- Filter the graph points that display by making the appropriate selections from the Machines, Profiles, and Tests menus.
- Complete one of the following:
- Right-click any area of the graph , then and choose Export Graph Points from the shortcut menu. . This will export all graph points that occurred during the load test.
- Specify a time interval by moving the mouse while pressing the left mouse button and ALT on the Alt keyboard button to place a gray box over the desired time interval on the graph, then right-click the gray box and choose Export Graph Points from the shortcut menu. This will export all individual hits that occurred during the specified time interval.
In the dialog box that opens, choose the location to where you would like to save the CSV file.
Note title Note The Export Graph Points option is only available if the Record individual hits option was preselected from the Report Settings tab of the Scenarios configuration panel. For more information, see Preselecting Detailed Report Options.
...
- Right-click the desired bar in the Graph tab legend and select Change Color from the shortcut menu. Within the Change Color shortcut menu are two sub-menus:
- In Report Only: Select to customize the color for the current Detailed Report only.
- In Report and Configuration: Select to customize the color for the current Detailed Report, and all Detailed Reports to follow.
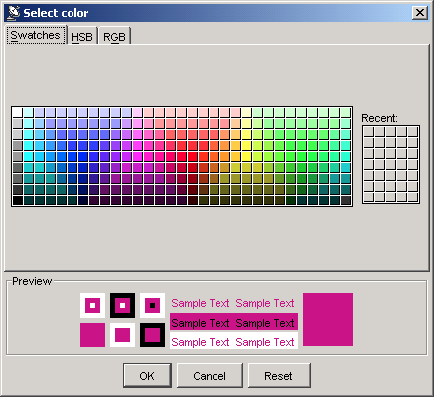
- Manipulate the color scheme as needed in the dialog box and click OK.
...
- Choose a variable from the X axis drop-down menu at the top of the histogram results panel.
- If you want to use a logarithmic scale, check the enable Log Scale check box. A logarithmic scale allows you to see the shape of multiple bars on the same graph (even if the displayed values are very far from one another).
- To shift the histogram, move the mouse while pressing the left mouse button and SHIFT on the Shift keyboard button.
| Anchor | ||||
|---|---|---|---|---|
|
...
- Select the appropriate parameter values from the X axis box , and the appropriate check boxes options from the bottom of the graph to determine the graph report.
- Move the mouse while pressing the left mouse button and ALT on the Alt keyboard button to place a gray box over the desired time interval on the graph. To unselect the gray box, press ALT on the Alt keyboard button and mouse click the gray box.
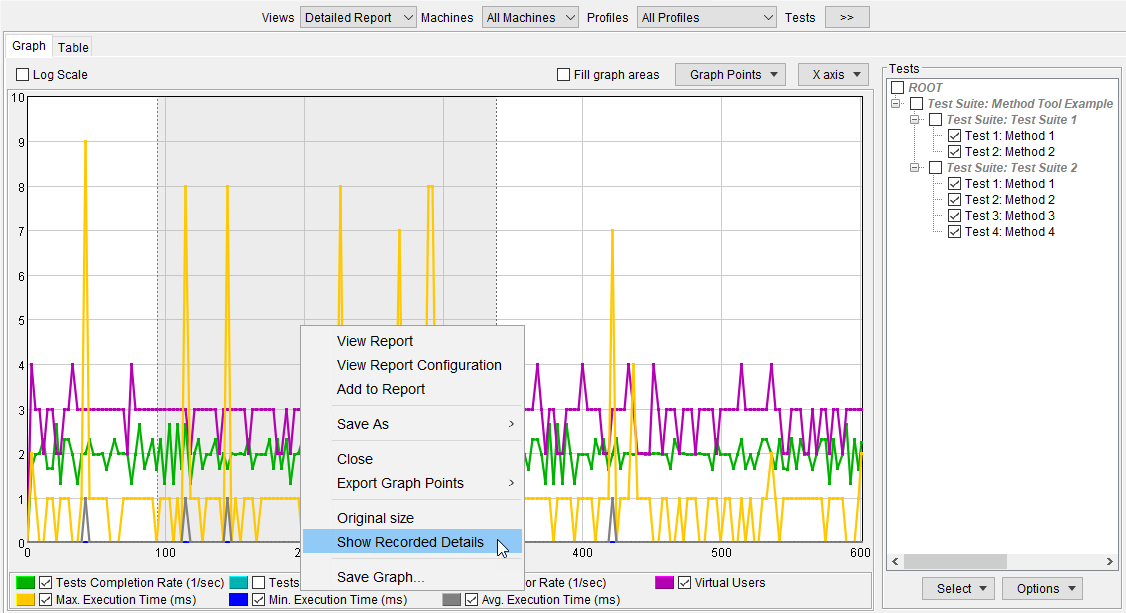
- Right-click the gray box and select Show Recorded Details from the shortcut menu. The Table tab opens and displays all of the recorded details collected during the selected time interval.
If you do not select a time interval, the Table tab opens and displays all available details after you right-click the graph and select Show Recorded Details from the shortcut menu.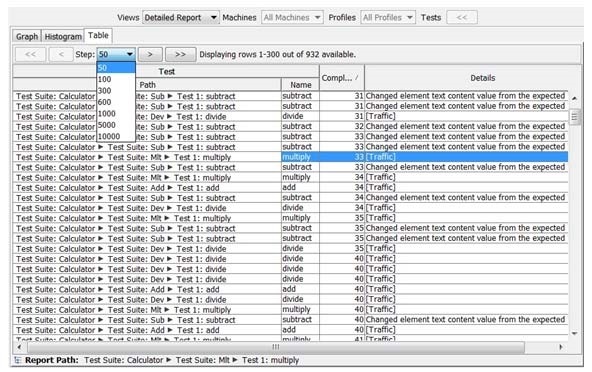
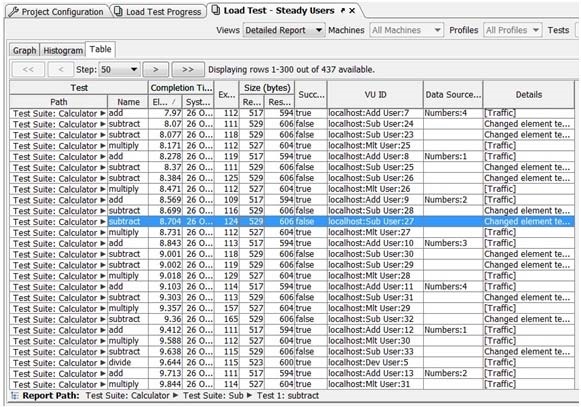
The Details column shows either the error string of the test (if it failed) or the [Traffic] tag (if the test succeeded). Double-click the row to see either error details or the traffic of the test.
The Table tab displays the first 300 detail results by default. If more than 300 details are present (if you selected to record all details or selected to record more than the first 300 details) a drop-down menu will appear at the top of the Table tab, along with navigation buttons that allow you to browse through groupings of details. - To access details about a specific test results, double-click the related report row.
To view individual hits in the Table tab, complete the following in the Graph tab:
- Select the Enable Show Individual Hits check box.
- Select the appropriate parameter values from the Y axis box.
- Move the mouse while pressing the left mouse button and ALT on the Alt keyboard button to place a gray box over the desired time interval on the graph. To unselect the gray box, press ALT on the Alt keyboard button and mouse click the gray box.
- Right-click the gray box and select Show Individual Hits from the shortcut menu. The Table tab opens and displays all of the individual hits that occurred during the selected time interval.
Rather than selecting a time interval, you can select a few points in the Graph tab by clicking and dragging your mouse to place a gray box around the points you want to focus on, and then right-clicking and selecting Show Individual Hits from the shortcut menu.
You can also double-click a single point in the Graph tab and the Table tab will open and display information for the single hit you selected.
If details information has been recorded for the hit, the Details column of the Individual Hits table will contain the error details of the test (if the test failed) or the [Traffic] tag (if the test succeeded). Double-click the row to see either error details or the traffic of the test the test for which the details were recorded.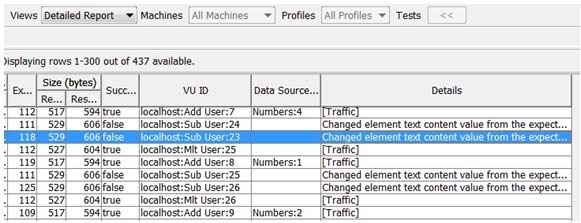
...
You can see all hits of a Virtual User by right-clicking a row in the Individual Hits table , then and choosing Show All Hits of This VU from the shortcut menu.
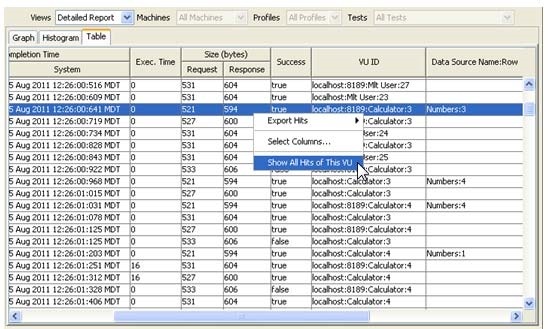
This opens a table with all hits of the selected Virtual User.
...
To return to the Individual Hits table, click the Show Previous Table << button.
Customizing Available Report Columns
...
- Right-click the table area of the Table tab and choose Select Columns.
- Choose Select Columns from the shortcut menu.
- Use the controls in the Columns Configuration dialog box to specify which columns you want shown.
- (Optional) If you want Load Test to apply this same configuration to all subsequent load test reports for the current project, click Save Configuration before closing this dialog box.
...
The Quality of Service (QoS) Report shows the metrics that you have configured in the Load Test , and displays a Summary tab and a Details tab.
The Summary tab displays a Metric, Description, and Status column. Each row in the QoS report corresponds to one QoS metric.
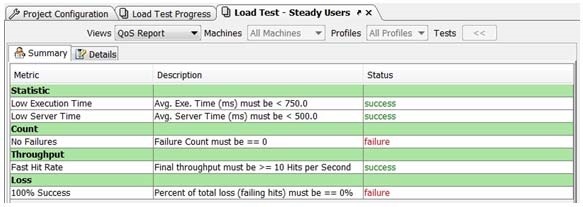
The Details tab displays shows the results of the available metrics that have been configured for the selected scenario. The Details tab also displays shows the name, parameters, and notes for the metric selected from the Metric List.
...
You can further customize the metrics in the reports by configuring the parameters of any metric from the Metric List and clicking the Apply to Report button. You can also select multiple metrics from the Metric List (CTRL-click) and then click the Apply to Report button. This will update the QoS Results that are seen in the QoS Report and Test Information views, but will not reflect in the QoS node of the Scenario View.
...
You can also right-click anywhere in the Load Tests tab and select choose View Structure Report> Report > HTML/XML. A Load Test Configuration Report displays in your browser. This report contains the following information:
- Load Test Scenarios: Displays any load test scenarios that were created and run for the selected project. You may click on the QoS metric name within the report , and additional information will display such as the Scenario, Group, and Description of the metric.
...
| Report Type | Applies To | Contains | Instructions |
|---|---|---|---|
| Binary (.rpt) | All report views | All reports | Right-click the active report area .Chooseand choose Save As Binary from the shortcut menu. |
| HTML (.htm, .html) | All report views | All reports | Right-click the active report area .Chooseand choose View Report .Use, then use the browser controls to save the report. |
| XML (.xml) | Statistics report view | Selected Report | Right-click the active report area in the Statistics report view .Chooseand choose Export XML from the shortcut menu. |
| Image/GIF (.gif) | Detailed Report Graphs and Histograms | Selected Report | Right-click the active report area in either Detailed Report Graph tab or Histogram tab .Chooseand choose Save Graph from the shortcut menu. |
| Comma Separated Values (.csv) | Statistics report view or Detailed Report Errors | Selected Report | Right-click the table area in the Statistics report view .Chooseand choose Export Table from the shortcut menu. |
To open a binary-format report, you choose File> Open, then use the file chooser to specify which go to File > Open and navigate to the .rpt file you want to open.
...
- Open the Detailed Report view of the load test report.
- Select an interval that you would like to save. To select an interval, move the mouse while pressing the left mouse button and ALT on the Alt keyboard button to place a gray selection box over the desired time interval on the graph.
- Release the Alt button, ALT key and right-click in the graph and choose the Save As> Binary> , then go to Save As > Binary > Selected Interval command.
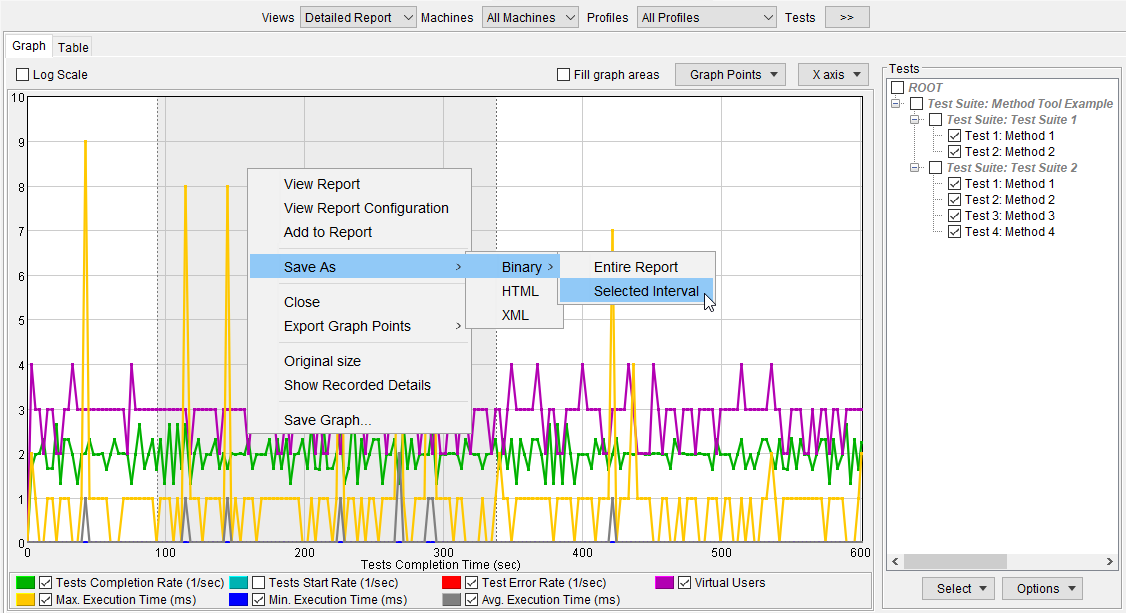
- Enter the report file name in the file selection dialog.
...
| Info | ||
|---|---|---|
| ||
When saving a part of a load test report, keep in mind that the report data is collected and saved in approximately 3-second intervals. When a part of a report is saved, all the intervals that have been included into the selection are saved. An interval is selected when a graph node which represents that interval is selected. For example, the 8.5-second to 14-second selection shown in the image below includes graph nodes at 9.1 and 12.1 seconds, which represent the following data collection intervals:
These two intervals will be saved in the report. The saved report interval will contain two graph points. Individual hits that belong to both intervals will be saved in the report.
|
...
- Open the HTML Report Options dialog box by completing one of the following:
- Right-click in the active area of any report view (i.e. for example, Test Information, Statistics, Detailed Report) and select View Report Configuration from the shortcut menu. An HTML Report Options dialog box displays opens with three graph entries by default.
- Right-click in the active area of either the Graph tab or Histogram tab of the Detailed Report view and select Add to Report from the shortcut menu. An HTML Report Options dialog box displays opens with the current Graph or Histogram view options added to the three default graph entries.
Each entry in the HTML Report Options dialog box reflects options of a graph or histogram view that will display in the HTML report. You can add and/or remove graph entries by right-clicking in the dialog box and selecting Add Graph/Remove Graph from the shortcut menuGraph.
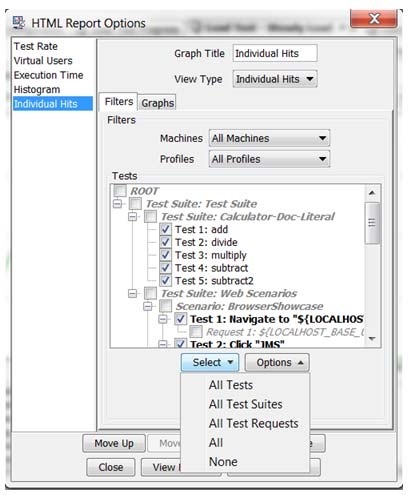
- Configure the graph entries by customizing the following options for each entry:
- Graph Title: Enter a title for the graph as it will display in the HTML report.
- View Type: Select Choose to display either a Graph or a Histogram in the HTML report.
- Filters: Select Choose the desired choices from the Machines and Profiles drop-down menus and in the Tests tree selection view to filter HTML report graphs accordingly.
- X Axis: (Only available for Graph View Types) Select Choose the parameter to display as the X Axis of the graph.
- Y Axis: Select Choose the parameters to display on the Y Axis of the graph. You can select multiple parameters by pressing CTRL on the Ctrl keyboard button while clicking your left mouse button. These parameters are the same parameters that display in the Graph tab legend of a Detailed Report view.
Log Scale: If you want to use a logarithmic scale, check the enable Log Scale check box. A logarithmic scale allows you to see the shape of multiple bars on the same graph (even if the displayed values are very far from one another).
Save in Project: Click to save the report to the current project. The next load test report generated for that project will have the saved HTML report options by default. However, if the report is a standalone report (loaded from disk rather than part of a current project) the Save in Project button will not be available.
- View Report: Click to view the HTML report in your web browser.
- Close: Click to close the HTML Report Options dialog box.
- Click theView Report button. The HTML Report opens in your Web browser and displays the customized graph views.
...
- Right-click the Reports node in the Load Tests tab and select choose New Composite from the shortcut menu. A Report Composite node displays appears beneath the Reports node and the Report Composite controls display in the right GUI panel.
Click the New button at the bottom of the right GUI panel and browse to and open a saved report file (.rpt) in the dialog box that displaysopens. A node corresponding to the file you opened displays in italics beneath the Report Composite node in the Load Tests tree.
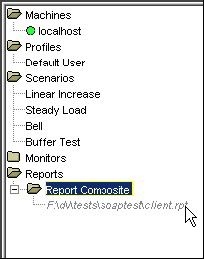
Note title Note Report composite entries are displayed in italics to emphasize that they are references to reports. By default, when a project is reopened, or when a new reference is created, the report composite is not loaded and displays in gray. After a report composite is loaded, it displays in black. - Repeat Step 2 until you have added all of the report composites you would like to load.
Right-click the Report Composite node and select choose Load All from the shortcut menu. Load Test will load each of the report composites you added.
Note title Note You may also load individual report composites by selecting the appropriate node from beneath the Report Composite node and clicking the Load button in the right GUI panel. - (Optional) You may access the Test Information, Statistics, and Detailed Report views of each individual report composite by selecting the desired report composite node in the Load Test tree and then selecting from the Views drop-down menu in the right GUI panel.
...
After loading multiple load test reports, you can select the Report Composite node beneath the Reports node of the Load Tests tree to configure and compare the composite reports. The following options are available in in the Report Composite controls.
- Name: Enter a name for the Report Composites folder that will contain the report composites that you add and load.
- Persist as Relative Path: Select to ensure that the path of the composite reports you add are always relative to your project file.
- Views: The following views are available in the Report Composite controls.
- Information: Contains a table of report sources and titles. The Report Source is a file path to the report. By default, the Report Title is also a file path to the report, but can be changed by double-clicking a table row and changing the Report Title in the dialog that opens.
- Graph: Contains an overlaid graph that displays various detailed report parameters from each of the composite reports that you loaded.
To compare detailed report parameters within the Graph view, select the desired parameter from the Y-axis drop-down menu and then select the desired composite reports from the legend at the bottom of the right GUI panel. Now you can graphically compare the multiple load test reports to visualize performance changes between load test runs.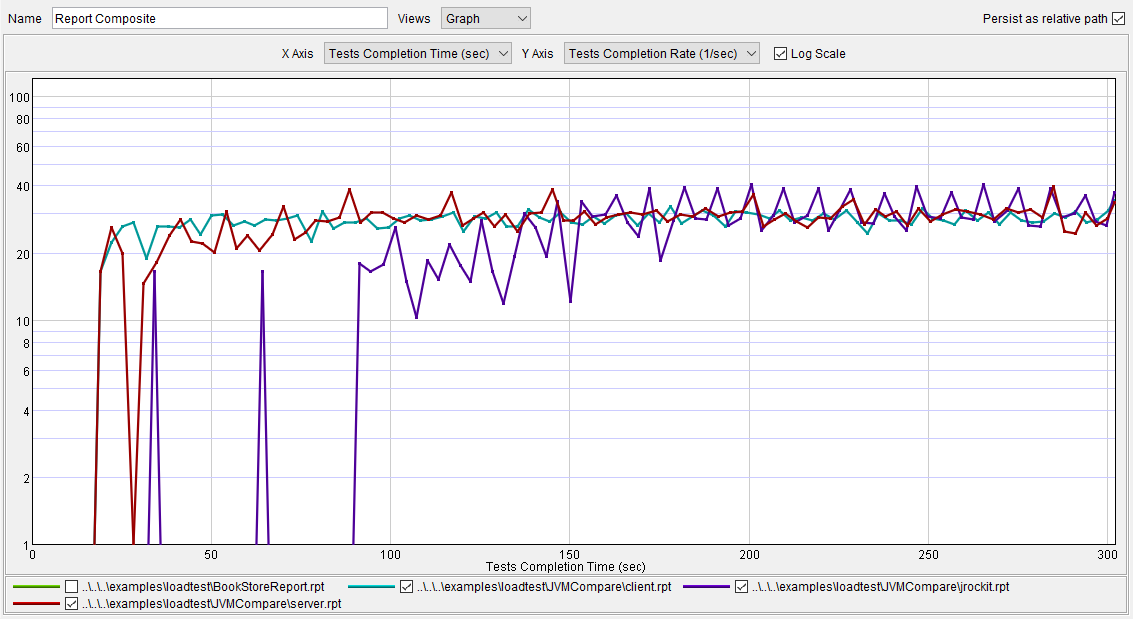
If you want to use a logarithmic scale, check the enable Log Scale check box. A logarithmic scale allows you to see the shape of multiple bars on the same graph (even if the displayed values are very far from one another).
...
The Active Report gives you access to all the data collected for a running load test scenario—during scenario during test execution , without having to stop the load test.
...
The Active Report should be used only when you need to see load test details that are not available in the Load Test Progress view—for view, for example, if you want to see error details while the load test is running.
...
- Launch a new instance of the Load Test application.
- Accessing the Active Report from the Load Test process that is running a load test scenario is not allowed. This is because opening and manipulating large reports may consume considerable memory and CPU resources, which may adversely affect the accuracy of the running load test scenario.
- The Load Test process that is used to access the Active Report must be launched from the same installation as the process that is running the Load Test scenario you want visibility into.
- Choose File> Go to File > Active Report.
You can manipulate and save the Active Report in the same way as the standard Load Test report.
To refresh the Active Report with the most up to date data:
...
, click Refresh in the report view header.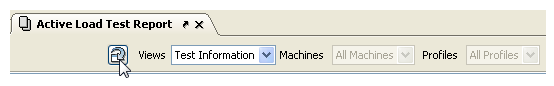
CPU Utilization Notes
- Use discretion in how often you update the Active Report view; reloading large reports can take considerable CPU resources from the machine and affect the accuracy of the Load Test scenario execution.
- Make sure that the average CPU utilization of the machine running the load test does not exceed 80% (on average).
- If you need to free the CPU resources on the load test controller machine for opening and manipulating the Active Report while the load test is running, redistribute the load to the remote machines.
...
You can typically use the Load Test report recovery feature to restore the load test data after a system crash or an application shutdown. To view recoverable reports:
- Choose File> Go to File > Recover Report. The Recover Report dialog will show the start date/time(s) of recoverable load test reports. Recovery data is deleted 5 days after creation. Report data that is more than 5 days old cannot be recovered.
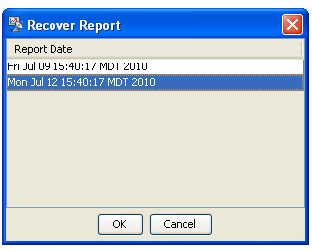
- Select a report and click OK.
...
The following are definitions for terms used in load test reports:
- Inter-Invocation Time: Time between subsequent requests "on the wire". The requests may be coming from different VUs.
- Server Time: The time from the last byte sent to the first byte received.
- Total Execution Time (Execution Time): The time from the first byte sent to the last byte received.
- Request Send Time: The time from the first byte sent to the last byte sent.
- Response Receive Time: The time from the first byte received to the last byte received.
- Ping Time: Time to establish an HTTP connection to the SOAP endpoint under test. This time is used as an estimate of the network layer latency.
- Total Size: Total size of the request and the response.
...
In more detail, "Connection Reset" is not an error message unique to Parasoft Load Test; it is generated by Java and it corresponds to specific low-level events. Connection Reset will be reported by Java (in this case the JVM running Load Test) when it uses an RST (short for reset) message to abort the connection. This will happen if the JVM encounters any prematurely closed connections on the server side. A prematurely closed connection indicates that while Load Test is receiving the response, the server is closing the connection—thus connection, thus causing the Load Test JVM to forcibly issue a "reset" that aborts the connection. This is not a feature of Load Test; rather, it is a behavior of the JVM in order to comply with the TCP protocol specifications.
...
The Connection Reset can be difficult to understand. It is easiest to think of it as a symptom of a problem that has already happened. In other words, the reset connection is not the problem—the problem; the problem is the prematurely closed connection that occurred on the server which caused the Connection Reset in Load Test.
...