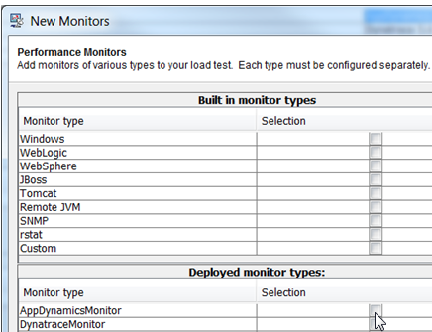
AppDynamicsAdding AppDynamics MonitorsTo add an AppDynamics monitor: - Right-click the Load Test tab’s Monitors node, then choose New Monitors from the shortcut menu. A New Monitors dialog displaysopens.
- Select AppDynamicsMonitor from the New Monitors dialog’s Deployed monitor types table, then click Finish.
 - In the upper-right corner of the Project Configuration panel, click the Properties button and configure the AppDynamics properties.
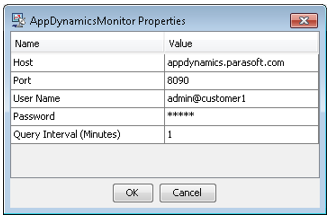
- Host – host where the AppDynamics server is installed.
- Port – port where AppDynamics is listening for REST calls.
- User Name – user name for REST calls authentication.
- Password – password for REST calls authentication.
- Query Interval (Minutes) – time in minutes over which the monitor values are averaged. The minimum value is 1 minute.
- Click OK to save the property values in the project.
- To add channels to the AppDynamics monitor:
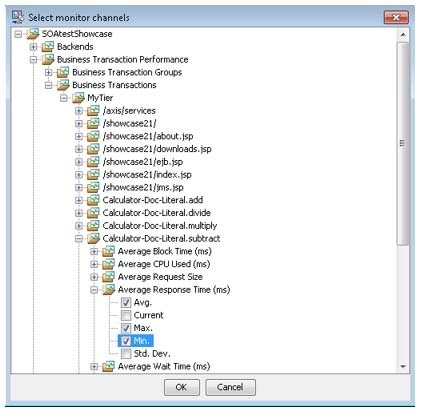
- Click the New button in the Deployed monitor panel panel of the Project Configuration tab. The monitor channel selection dialog displays. The top-level nodes in monitor channel tree are applications monitored by AppDynamics.
- Expand the top level application nodes until you reach the channel leaf nodes with check boxes.
- Ensure that the items you want to monitor are checked.
- Click OK to to have selected nodes added to the Parameters table of the Deployed monitor configuration panel. The parameters you choose will display in Load Test Progress graphs as well as in Detailed Report graphs.
| Tip |
|---|
| Open the Properties dialog and click the OK button to reset the monitor channel selection tree. The monitor channels tree will display the top-level application nodes based on the data provided by AppDynamics. The child nodes will be dynamically constructed based on queries sent to AppDynamics as you click the tree’s expand icons “[+]”. |
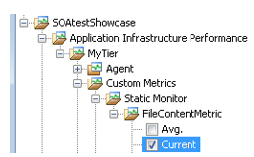
Monitoring Data Available from AppDynamics Monitoring ExtensionsThe AppDynamics Exchange site offers a number of Monitoring Extensions. Monitoring Extension data available in AppDynamics Metric Browser will be available in the Load Test AppDynamics monitor. The screenshots below show the data exposed by the ‘Static’ Monitoring Extension available from the Exchange in the AppDynamics Metric Browser View and the Load Test AppDynamics monitor channel selection view. Custom FileContentMetric in AppDynamics:
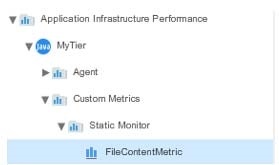
Custom FileContentMetric in Load Test AppDynamics Monitor:
 DynatraceAdding Dynatrace MonitorsTo add a Dynatrace monitor: - Right-click the Load Test tab’s Monitors node, then choose New Monitors from the shortcut menu. A New Monitors dialog displaysopens.
- Select DynatraceMonitor from the New Monitors dialog’s Deployed monitor types table, then click Finish.
- In the upper-right corner of the Project Configuration panel, click the Properties button and configure the Dynatrace properties.
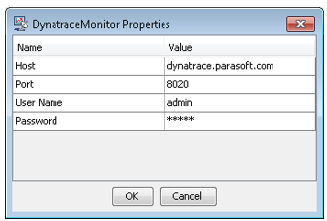
- Host – host where the Dynatrace server is installed.
- Port - port where Dynatrace is listening for REST calls. Default port is 8020. Refer to the Dynatrace documentation for more details.
- User Name - user name for REST calls authentication.
- Password - password for REST calls authentication.
- Click OK to save the property values in the project.
- To add channels to the Dynatrace monitor:
- Click the New button in the Deployed monitor panel panel of the Project Configuration tab. The monitor channel selection dialog displaysopens.
- Expand the top-level application nodes until you reach the channel leaf nodes with check boxes.
- Ensure that the items you want to monitor are checked.
- Click OK to to have selected nodes added to the Parameters table of the Deployed monitor configuration panel. The parameters you choose will display in Load Test Progress graphs as well as in Detailed Report graphs.
The monitor channel selection view tree is structured in the following way: - Level 1: Dynatrace dashboards
- Level 2: Chart Dashlets in a dashboard
- Level 3: Measures in a Chart Dashlet
- Level 4: Min/Max/Avg vales of the Measure
You can monitor either existing Chart Dashlets of Line Chart type or create new ones. You can add multiple Measures (data series) to a Chart Dashlet. See the Dynatrace vendor documentation for more details. | Tip |
|---|
| Open the Properties dialog and click the OK button to reset the monitor channel selection tree. The monitor channels tree will display the top-level application nodes based on the data provided by Dynatrace. The child nodes will be dynamically constructed based on queries sent to Dynatrace as you click the tree’s expand icons “[+]”. |
Dynatrace REST Query Response Size ConsiderationsThe sizes of the Dynatrace REST responses can be quite large (100KB and more), depending on the Chart and Dashboard configurations. To minimize the size of the Dynatrace REST query responses: - In the charts of the dashboards that are being monitored by Load Test, choose the following settings in the Chart control panel in the top right corner of the Chart view.
- Select Timeframe: set to ‘last last 5 minutes’minutes.
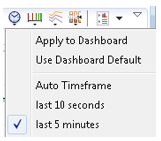 - Select Chart Resolution: set set to ‘10s’ 10s.
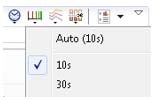
- To apply these settings to all charts in a dashboard, choose the Apply to Dashboard command in the right-click menu shown in screenshots above.
- To estimate the sizes of responses of REST queries of dashboards that are used by the Load Test Dynatrace monitor, open the query results in a browser using the following URL template (after substituting the host, port and the dashboard names to the ones relevant to your environment): http://dynatrace.parasoft.com:8020/rest/management/dashboard/your_dashboard_name
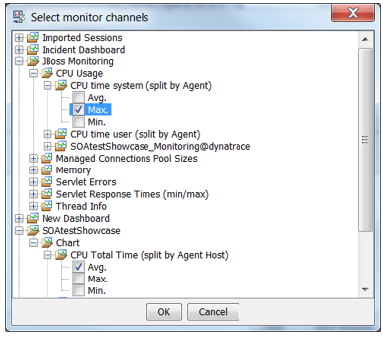
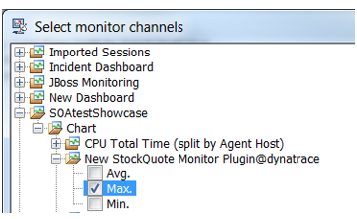
Monitoring Data Available from Dynatrace PluginsThe Dynatrace ‘PLUGIN CENTRAL’ site and ‘Community Plugins and Extensions’ site contain a number of plugins, many of which can be used to extend the out-of-the box Dynatrace monitoring capabilities. The Dynatrace plugin data added as a Measure to a Chart Dashlet will be available in the Load Test Dynatrace monitor. The screenshots below show a StockQuote sample monitor plugin available from the ‘Community Plugins and Extensions’ site added as Measure in a Dynatrace Chart Dashlet and in Load Test Dynatrace monitor channel selection view. Custom StockQuote Measure in Dynatrace:
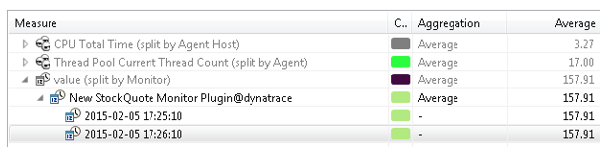
Custom StockQuote Channel in Load Test Dynatrace monitor:
 JVM ThreadsAdding Remote JVM Threads MonitorsThe JVM Threads Monitor allows you to observe threads statistics, as well as record individual thread details of a remote Java application using Java JMX technology. | Anchor |
|---|
| enable-jvx-monitoring |
|---|
| enable-jvx-monitoring |
|---|
|
| Info |
|---|
| title | Enabling JMX Monitoring |
|---|
| To use this monitor, the JVM should be started with the following Java system properties to enable JMX monitoring: | Code Block |
|---|
-Dcom.sun.management.jmxremote
-Dcom.sun.management.jmxremote.port=7744
-Dcom.sun.management.jmxremote.ssl=false
-Dcom.sun.management.jmxremote.authenticate=false |
Use the port of your choice with the com.sun.management.jmxremote.port system property. |
To add a Remote JVM Threads Monitor - Right-click the Monitors node in the Load Test tab and choose New Monitors from the shortcut menu.
- Choose JVMThreadsMonitor from the New Monitors dialog’s Deployed monitor types table and click Finish.
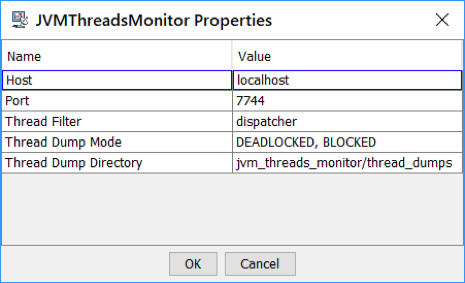
- In the upper-right corner of the Project Configuration panel, click the Properties button and configure the JVMThreadsMonitor properties.
- Click OK to save the property values in the project.
- To add channels to the JVM Threads monitor:
- Click New in in the Deployed monitor panel of the Project Configuration tab. The monitor channel selection dialog displaysopens.
- Enable the channels you want to monitor. Channel details are available in the Description column of the channel selection dialog.
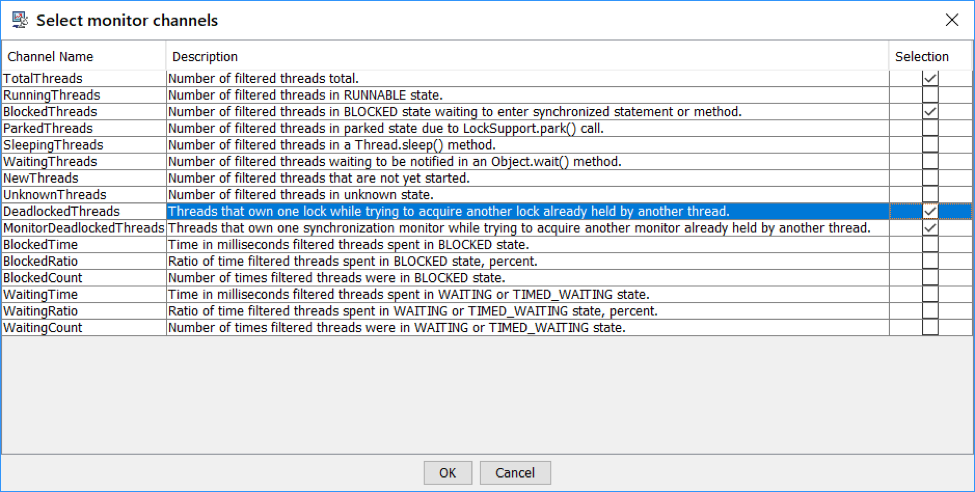
About Channel Descriptors| TotalThreads | Number of filtered threads. |
|---|
| RunningThreads | Number of filtered threads in RUNNABLE state |
|---|
| BlockedThreads | Number of filtered threads in BLOCKED state waiting to enter synchronized statement or method. |
|---|
| ParkedThreads | Number of filtered threads in parked state due to LockSupport.park() call. |
|---|
| SleepingThreads | Number of filtered threads in a Thread.sleep() method. |
|---|
| WaitingThreads | Number of filtered threads waiting to be notified in an Object.wait() method. |
|---|
| NewThreads | Number of threads that are not yet started. |
|---|
| UnknownThreads | Number of threads in unknown state. |
|---|
| DeadlockedThreads | Threads that own one lock while trying to acquire another lock already held by another thread. This channel finds locks involving both object monitors and ownable synchronizers, such as java.util.concurrent.locks.ReentrantLock and java.util.concurrent.locks.ReentrantReadWriteLock |
|---|
| MonitorDeadlockedThreads | Threads that own one synchronization monitor while trying to acquire another monitor already held by another thread. This method finds deadlocks involving only object monitors. |
|---|
| BlockedTime | Approximate time in milliseconds filtered threads spent in BLOCKED state during the Load Test data collection interval. |
|---|
| BlockedRatio | Approximate ratio of time filtered threads spent in BLOCKED state measured in percent. |
|---|
| BlockedCount | Number of times filtered threads were in BLOCKED state. |
|---|
| WaitedTime | Approximate time in milliseconds filtered threads spent in WAITING or TIMED_WAITING state. |
|---|
| WaitedRatio | Approximate ratio of time filtered threads spent in WAITING or TIMED_WAITING state measured in percent. |
|---|
| WaitedCount | Number of times filtered threads were in WAITING or TIMED_WAITING state. |
|---|
All data returned by monitor channels is related to the last Load Test data collection interval. The NEW, RUNNABLE, BLOCKED, WAITING, TIMED_WAITING, TERMINATED are the states from the State enumeration of the java.lang.Thread class. For details about JVM thread states, see the Java documentation for relevant Java classes: Upon initialization, the JMX Threads Monitor checks if thread contention monitoring is enabled on a remote JVM. If contention monitoring is disabled, the JMX Threads Monitor attempts to enable it. If this attempt fails, the BlockedTime, BlockedRatio, WaitedTime and WaitedRatio channels will return zero values. Taking Selective Thread DumpsThe JMX Threads Monitor allows you to take selective dumps of a remote application's threads and save them to disk for further analysis. This feature helps you catch undesired thread states that appear sporadically or record thread states during the automated load test runs. The JMX Threads Monitor will only dump threads when a load test is running. Thread dumps will not be taken when clicking Send Request in the monitor configuration view. Set the following monitor properties to configure selective thread dumps. Thread Filter | Only threads matching the Thread Filter will be dumped. |
|---|
Thread Dump Mode | The following values are available: - ALL: Dump all threads
- NONE or empty: Do not create thread dumps
- DEADLOCKED: Dumps deadlocked threads
- BLOCKED: Dump blocked threads
- PARKED: Dump parked threads
No thread dumps will be taken if this property is not configured (empty). Enter a comma-separated list of values to configure dumps of multiple thread states: DEADLOCKED, BLOCKED, PARKED |
|---|
| Thread Dump Directory | You can enter either an absolute path or a path relative to the following directory in SOAtest/LoadTest installation: <INSTALL><INSTALL_DIR>/plugins/com.parasoft.ptest.libs.web_<VERSION>/root No thread dumps will be taken if this property is not configured (empty). The path provided in this setting will be used as a thread dump root (see Examining Thread Dumps). |
|---|
Examining Thread DumpsThe path provided in the Thread Dump Directory setting will be used as a thread dump root. The JVM Threads Monitor will create a separate project thread dump directory under the thread dump root for each load test run. These project thread dump directories will have the following name pattern: PROJECTNAME_YYYY-MM-DD_hh-mm-ss. - PROJECTNAME: the name of the LoadTest project.
- YYYY: current year
- MM: current month
- DD: current date
- hh: hour of the day in 24-hour format
- mm: minute
- ss: second
This format allows you to clearly see which Load Test project a thread dump is related to and when it was created. The PROJECTNAME_YYYY-MM-DD_hh-mm-ss directory will not be created if the monitor does not find threads to dump that match the threads dump configuration during a load test run. The monitor will create thread dump files with the following name pattern inside the project thread dump directory: S..S_hh-mm-ss.txt - S..S: Elapsed Time in seconds since the beginning of the load test run when the threads dump was taken.
- hh-mm-ss: System Time when the thread dump was taken.
- hh: hour of the day in a 24-hour format
- mm: minute
- ss: second
Each thread dump file will contain one or more thread stack traces taken by the monitor. A thread stack trace will have the following format: | Code Block |
|---|
| THREAD_STATE thread: THREAD_NAME
thread_stack_entries |
Each BLOCKED thread will be followed by a stack trace of the thread that is blocking it. A BLOCKED thread output will have the following format: | Code Block |
|---|
| THREAD_STATE thread: THREAD_NAME
thread_stack_entries
------------------
Blocked by:
BLOCKING_THREAD_STATE thread: THREAD_NAME
blocking_thread_stack_entries |
Example: | Code Block |
|---|
| BLOCKED thread: Clinet Rec: LTPub_0.4104694862292172
com.acme.connections.ClientComms.isDisconnecting:561
...
java.util.concurrent.ThreadPoolExecutor$Worker.run:617
java.lang.Thread.run:745
------------------
Blocked by:
PARKED thread: acme_pool-2-UserCodeRunnable-135
sun.misc.Unsafe.park:-2
java.util.concurrent.locks.LockSupport.parkNanos:215
java.util.concurrent.locks.AbstractQueuedSynchronizer$ConditionObject.awaitNanos:2078
java.util.concurrent.ThreadPoolExecutor.awaitTermination:1465
... |
Matching Thread Dumps to Graph Points in the Load Test ReportTo find a thread dump for a particular point in the Load Test report graph follow there steps: - Hover the mouse cursor over a point in the Load Test report graph
- Use either the Elapsed Time or the System Time in the tooltip to find a dump file with the closest Elapsed or System time.
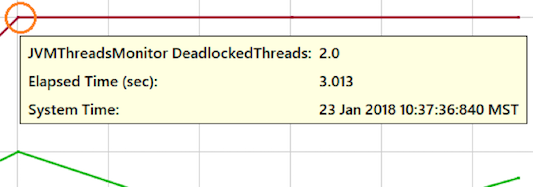
For example, the 3_10-37-37.txt file will be the thread dump file for the graph point highlighted in the screenshot. | 


